Copyright
©2007 Baishideng Publishing Group Inc.
World J Gastroenterol. Dec 14, 2007; 13(46): 6172-6182
Published online Dec 14, 2007. doi: 10.3748/wjg.v13.i46.6172
Published online Dec 14, 2007. doi: 10.3748/wjg.v13.i46.6172
Figure 1 Values of pleural effusion volumes (A) and calculated LW/BW ratios (B) (mean ± SD).
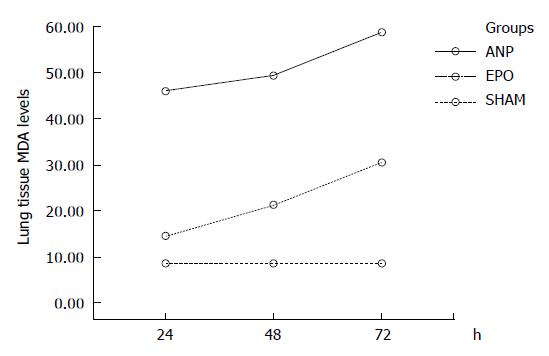
Figure 2 Values of MDA in lung tissue (mean ± SD).
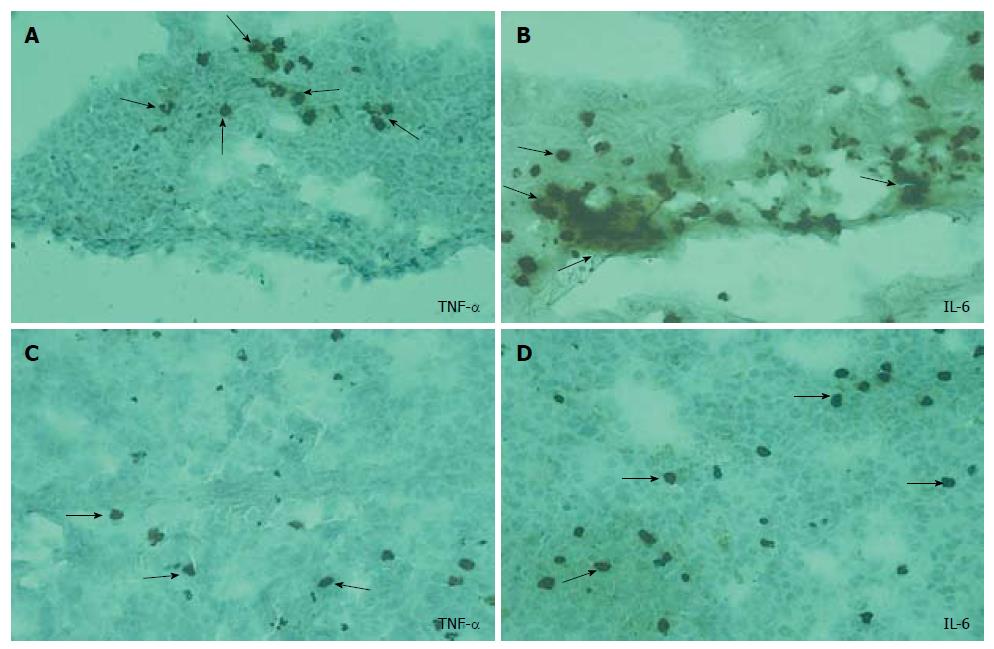
Figure 3 Light microscopic view of immunohistochemical staining for intracellular accumulations of TNF-α and IL-6 in the lung sections of ANP groups (A and B) and EPO groups (C and D) at 72 h.
Arrows indicate the significantly positive staining in ANP groups (A and B) and less intensive immnunohistochemical staining in EPO groups (C and D).
Figure 4 Lung tissue sections from EPO groups and ANP groups showing no fluorescent staining (A) and positive fluorescent staining (B) at 72 h.
Arrows indicate the accumulation areas of ox-LDL in the lung.
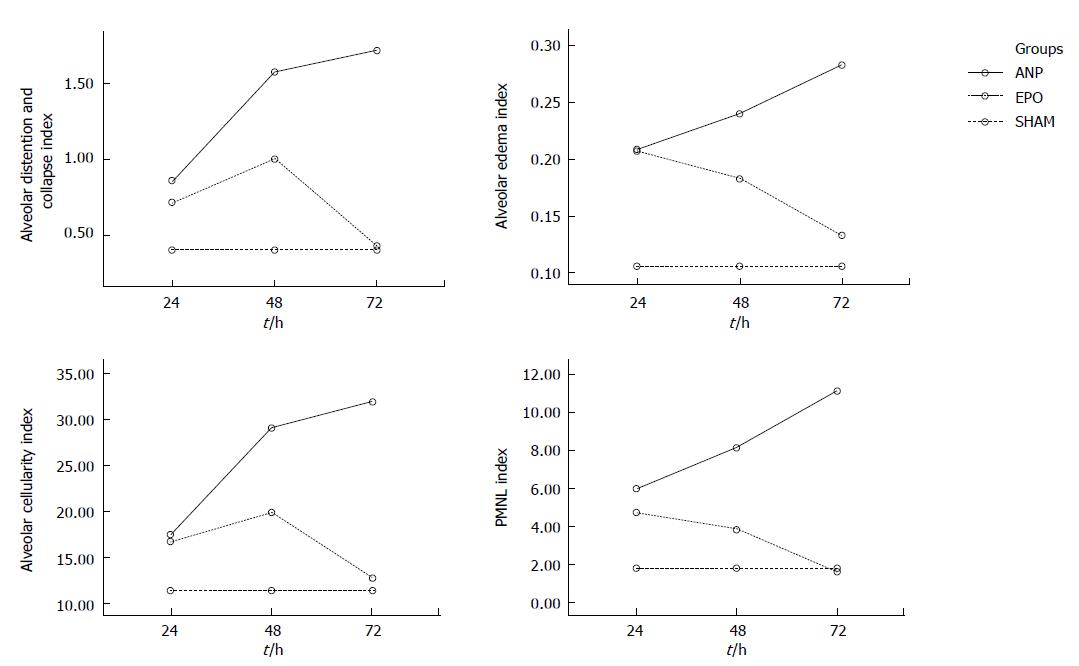
Figure 5 Mean values of alveolar distension and collapse index (A), alveolar edema index (percentage of the alveolar lumen filled with edema) (B), alveolar cellularity index (C) and polymorphonuclear cell index (D) obtained in the seven groups.
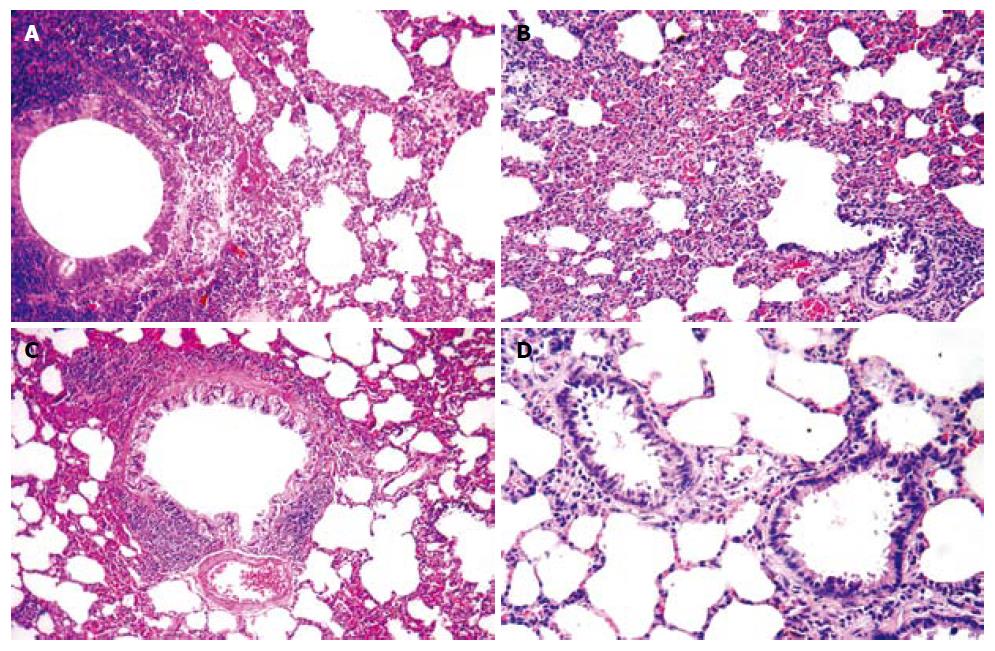
Figure 6 Light microscopy revealing significant lung injury-associated alveolar septal thickening, interstitial edema, infiltration of inflammatory cells, destruction of alveolar wall (emphysema), and microabscess formation in ANP groups at 48 h (A) and 72 h (B), and attenuation of inflammatory reaction, edema and emphysema in EPO groups at 48 h (C) and 72 h (D).
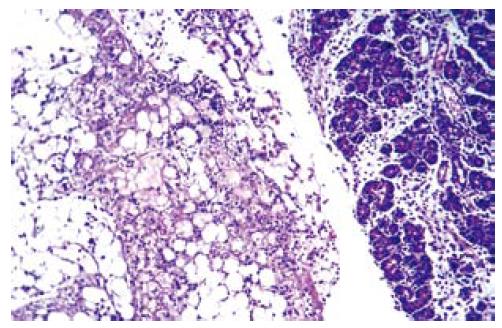
Figure 7 Light microscopic view of pancreatitis with severe fatty necrosis.
- Citation: Tascilar O, Cakmak GK, Tekin IO, Emre AU, Ucan BH, Bahadir B, Acikgoz S, Irkorucu O, Karakaya K, Balbaloglu H, Kertis G, Ankarali H, Comert M. Protective effects of erythropoietin against acute lung injury in a rat model of acute necrotizing pancreatitis. World J Gastroenterol 2007; 13(46): 6172-6182
- URL: https://www.wjgnet.com/1007-9327/full/v13/i46/6172.htm
- DOI: https://dx.doi.org/10.3748/wjg.v13.i46.6172


