Copyright
©2007 Baishideng Publishing Group Inc.
World J Gastroenterol. Nov 21, 2007; 13(43): 5731-5735
Published online Nov 21, 2007. doi: 10.3748/wjg.v13.i43.5731
Published online Nov 21, 2007. doi: 10.3748/wjg.v13.i43.5731
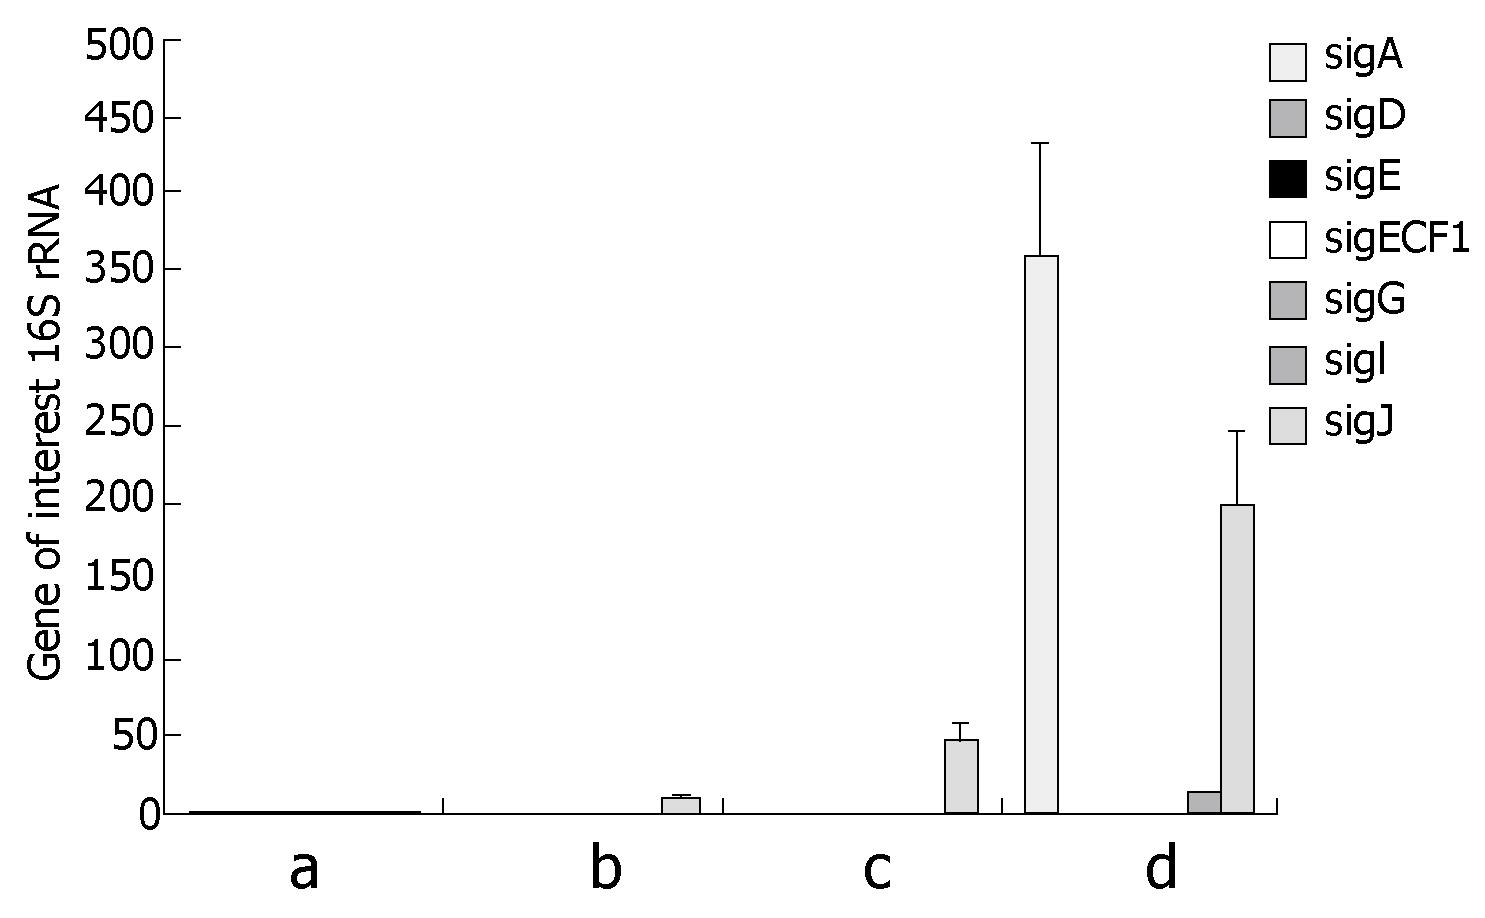
Figure 1 Relative quantification of expression of MAP sigma factors relative to the expression of the 16S rRNA MAP gene (calculated by the Biorad software) by Real Time PCR after different conditions of growth.
a: After growth in 7H9 medium plus mycobactin J; b: Infection of EGC after 6 h of incubation; c: Infection of EGC after 48 h of incubation; d: Infection of EGC cells after 7 d of incubation.
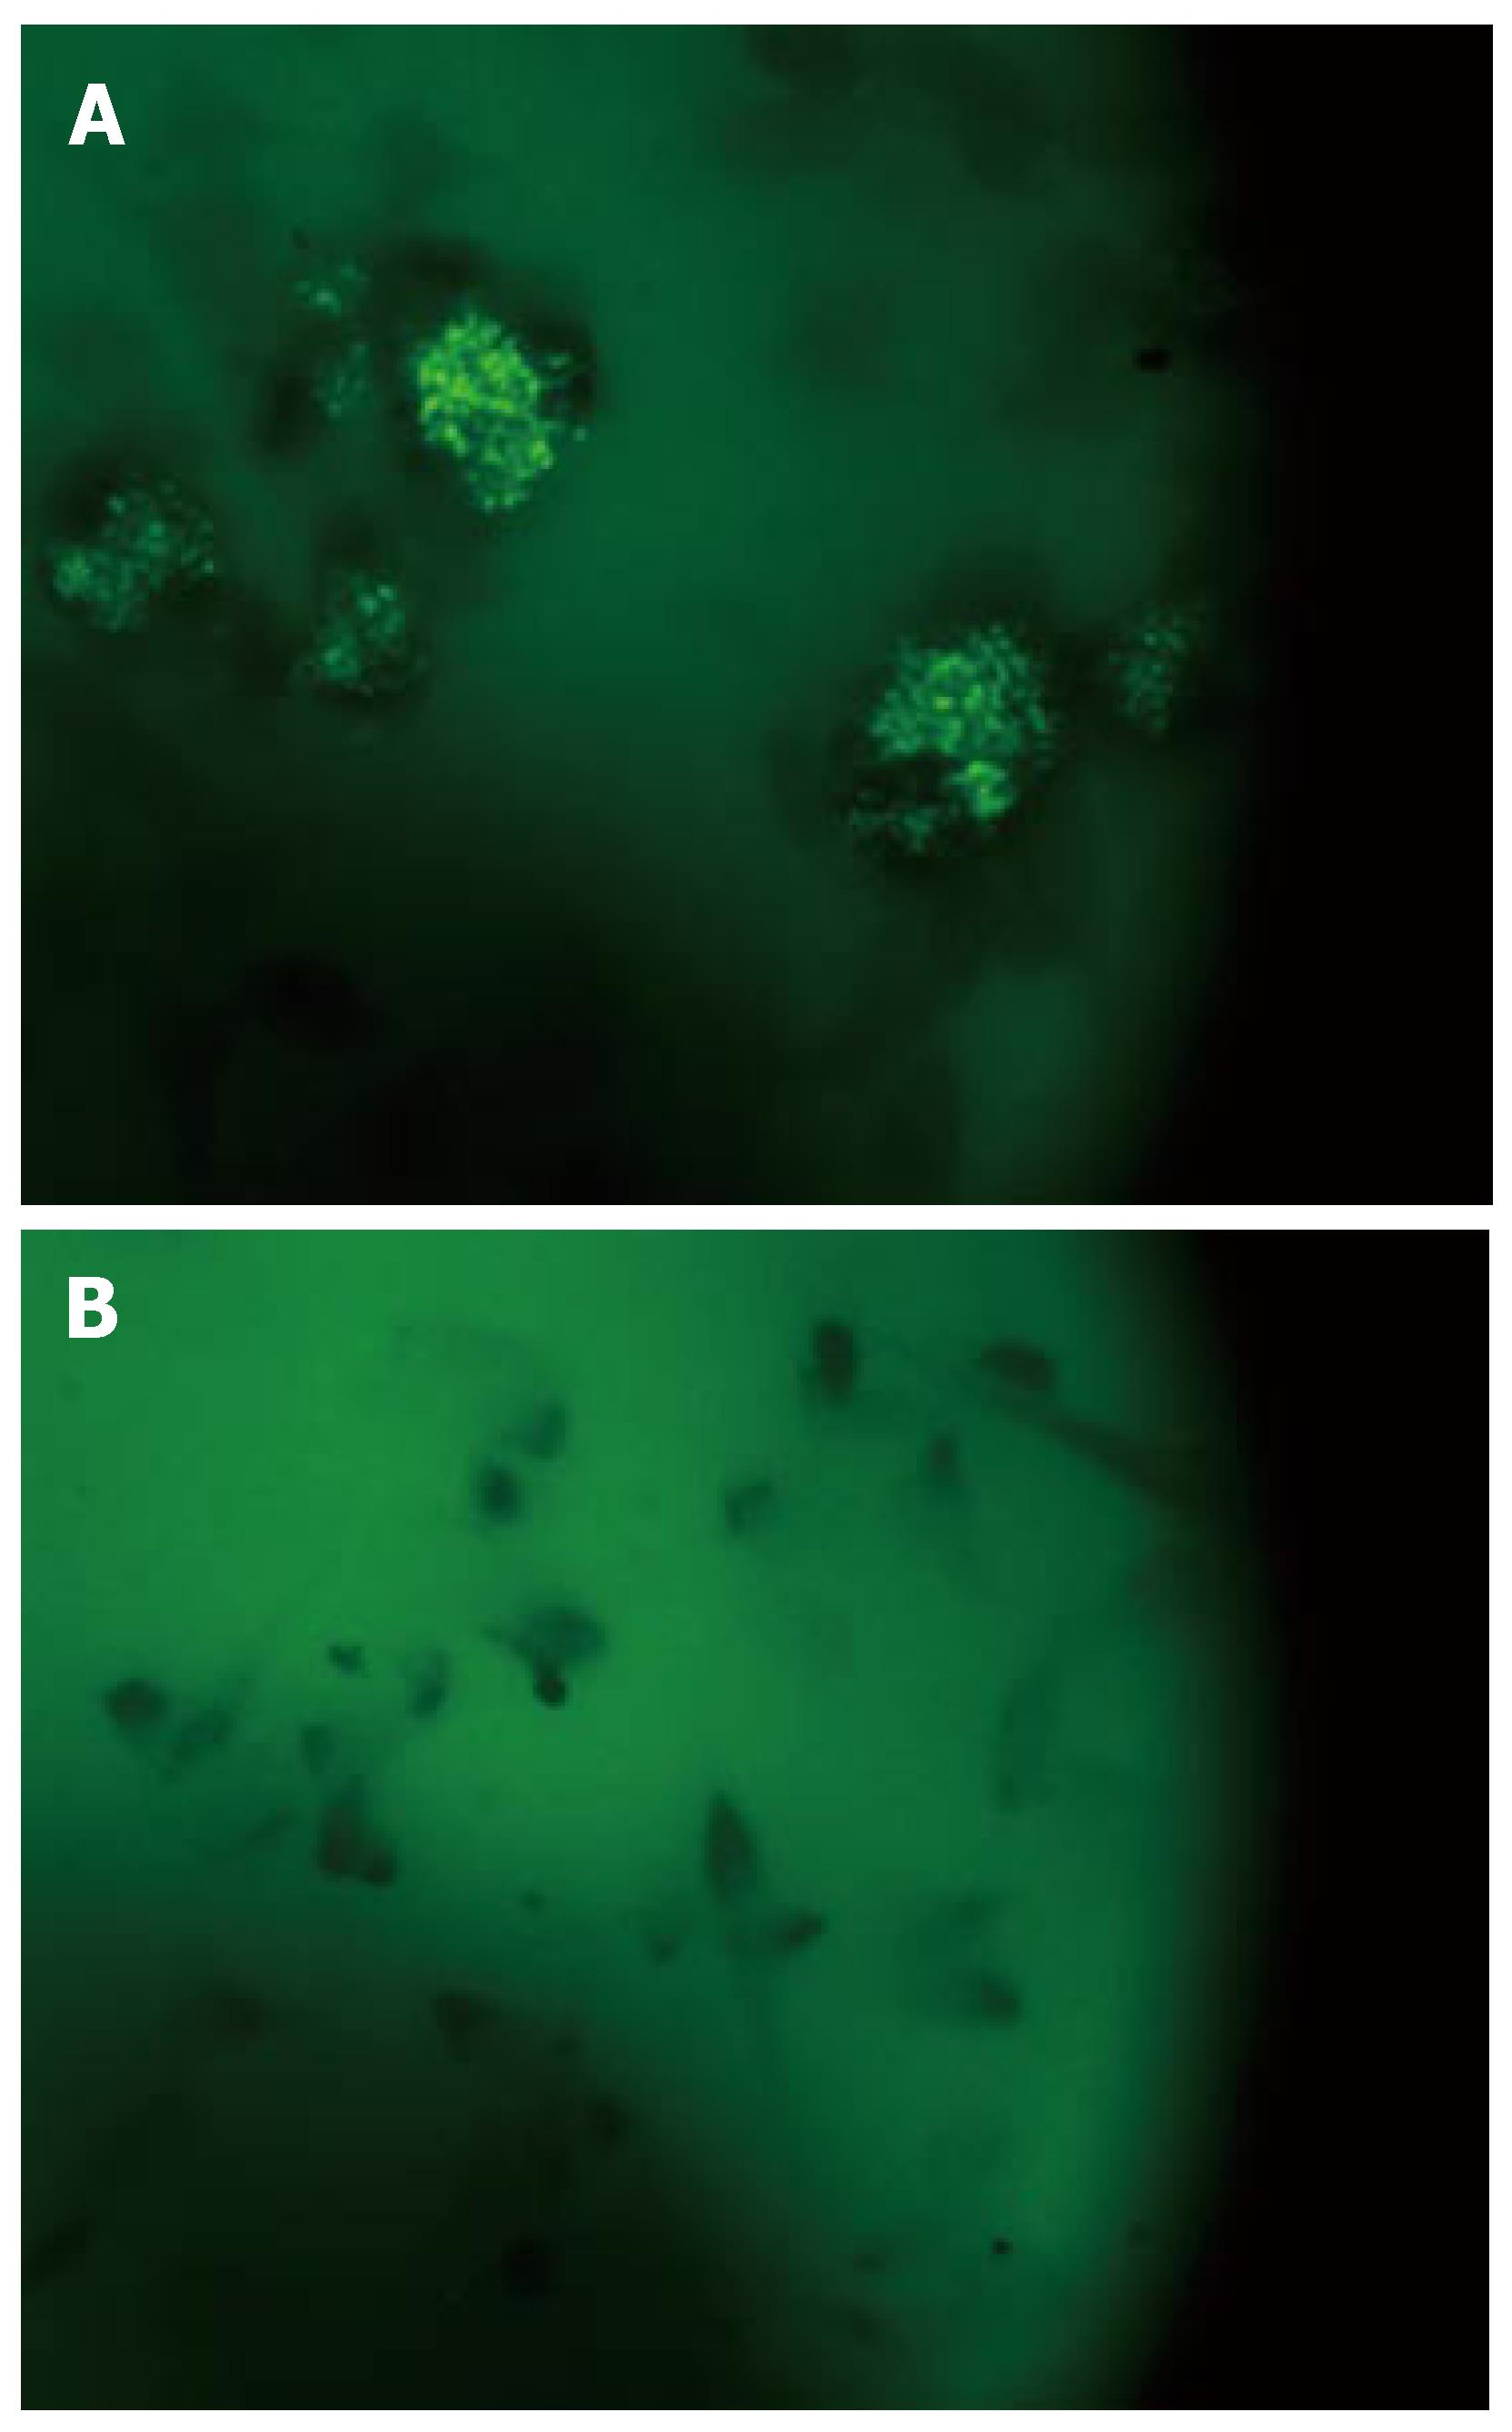
Figure 2 MAP cells stained with auramine rodhamine at 6 h after infection of EGC (A) and without infection (B) and visualized under a fluorescence microscope (× 100).
-
Citation: Sechi LA, Ruehl A, Ahmed N, Usai D, Paccagnini D, Felis GE, Zanetti S.
Mycobacterium avium subspeciesparatuberculosis infects and multiplies in enteric glial cells. World J Gastroenterol 2007; 13(43): 5731-5735 - URL: https://www.wjgnet.com/1007-9327/full/v13/i43/5731.htm
- DOI: https://dx.doi.org/10.3748/wjg.v13.i43.5731


