Copyright
©2007 Baishideng Publishing Group Inc.
World J Gastroenterol. Nov 21, 2007; 13(43): 5699-5706
Published online Nov 21, 2007. doi: 10.3748/wjg.v13.i43.5699
Published online Nov 21, 2007. doi: 10.3748/wjg.v13.i43.5699
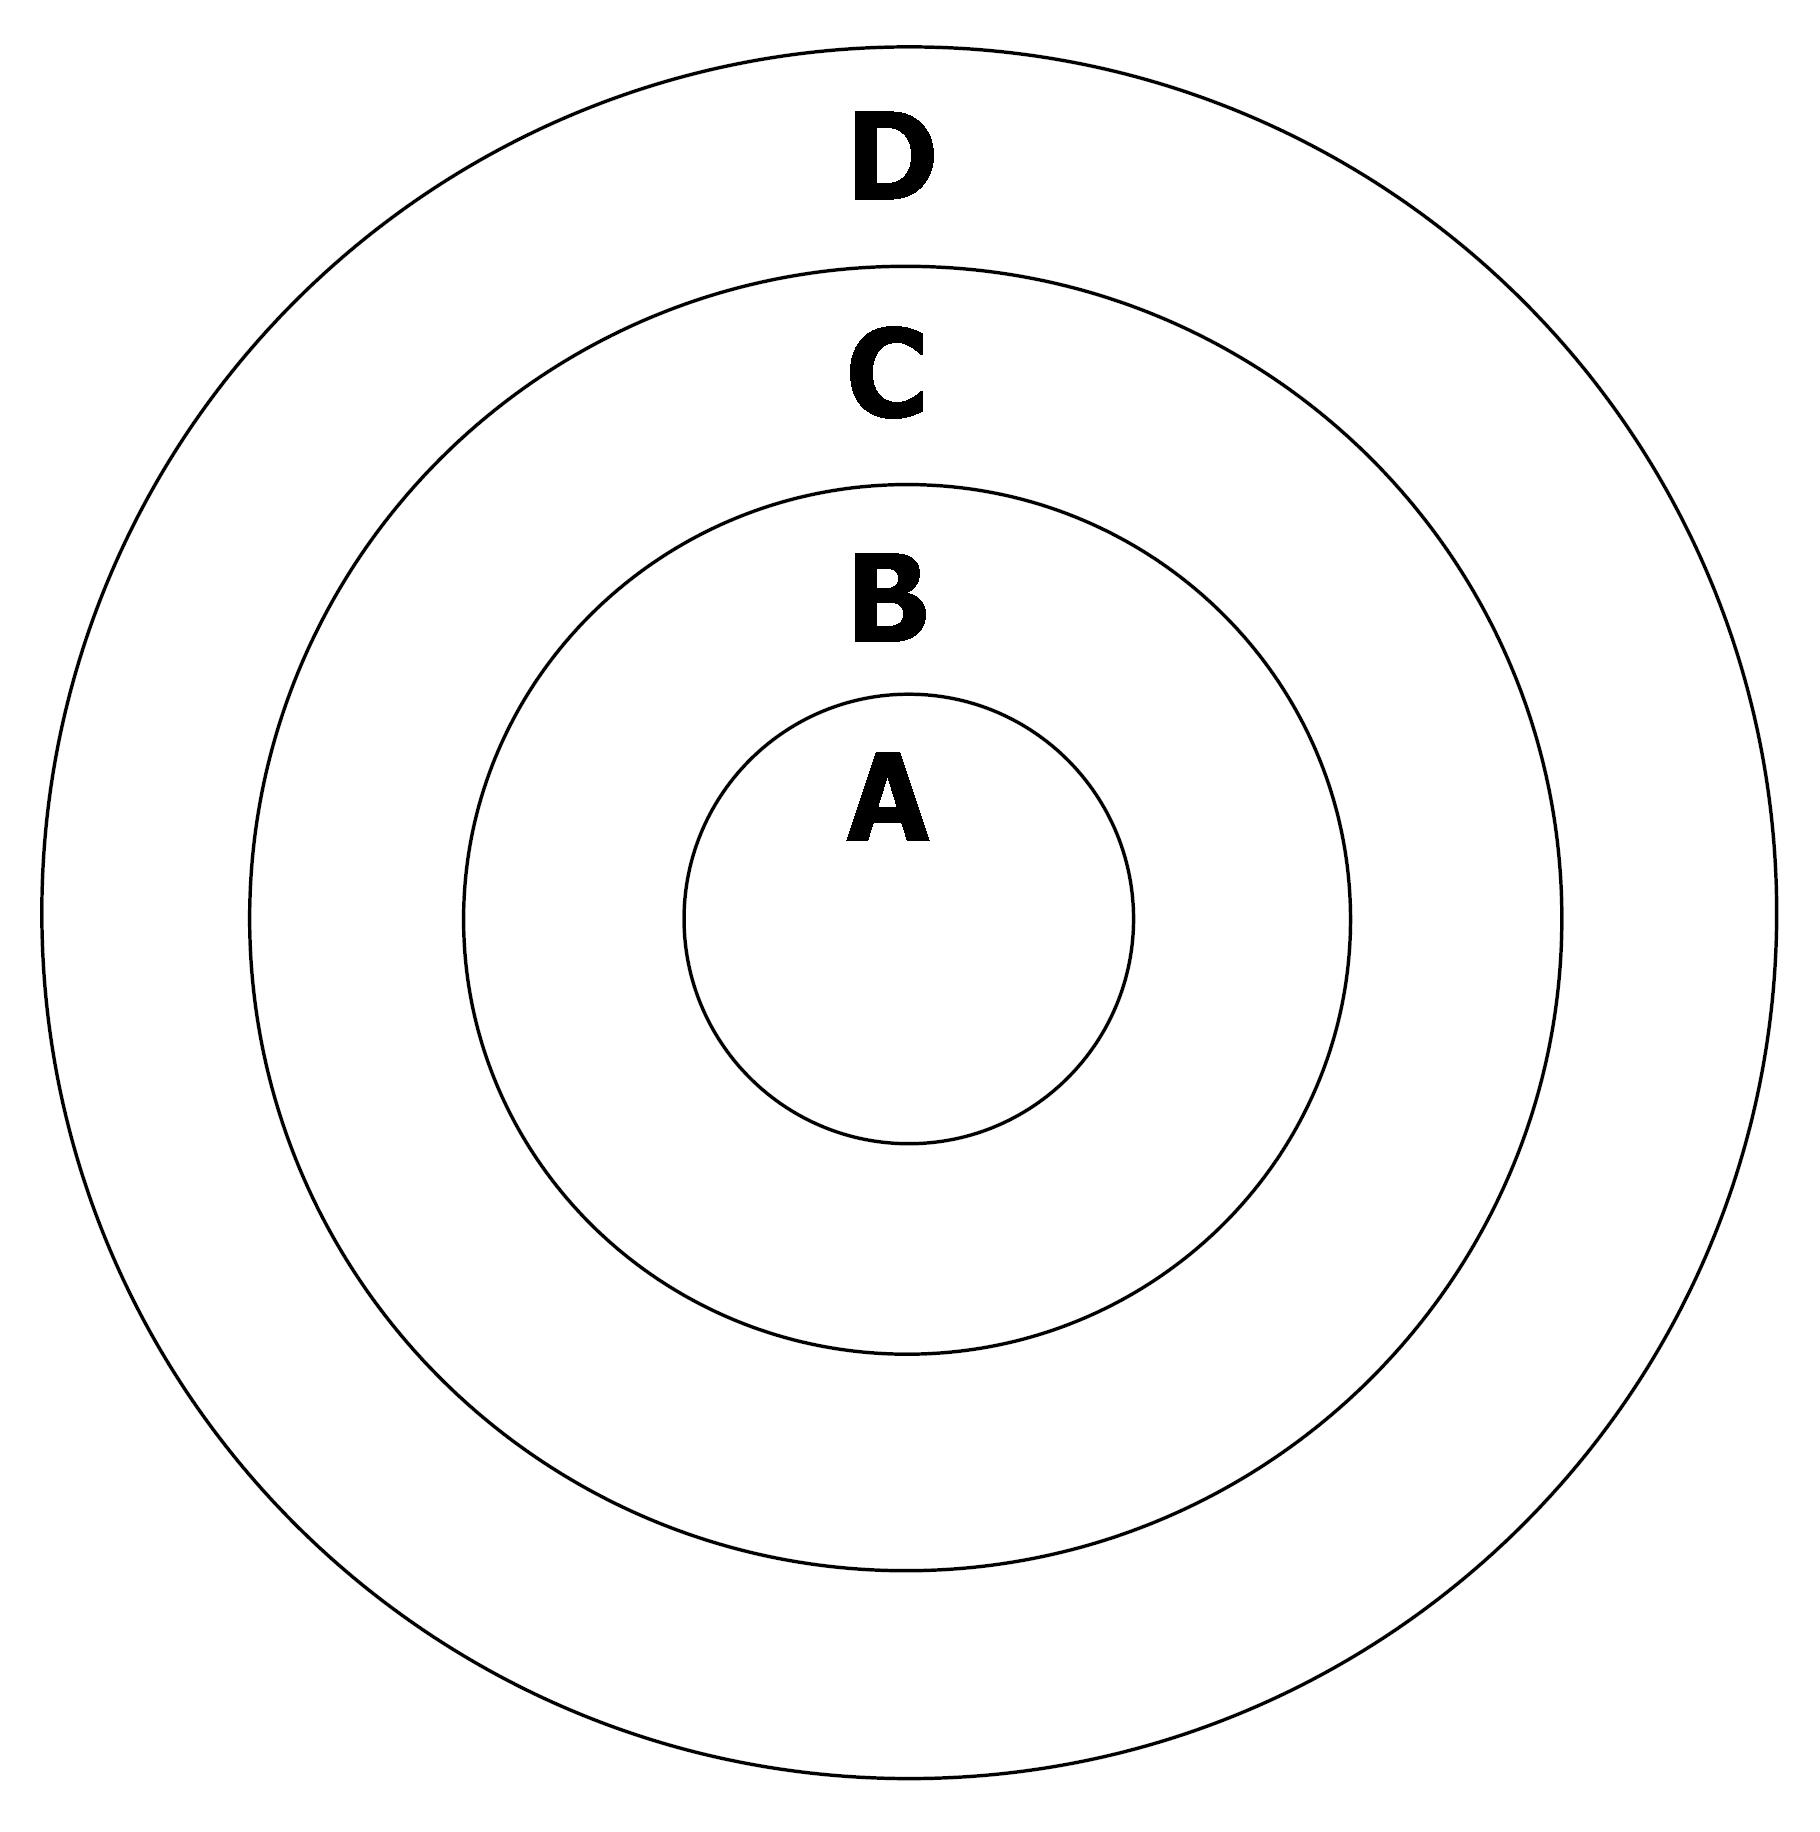
Figure 1 A: The area of VX-2 tumor center; B: The area of VX-2 tumor periphery; C: The area of VX-2 tumor outer layer; D: The normal liver parenchyma area around tumor when the values of ADC and signals were measured on DWI and samples were investigated pathologically.
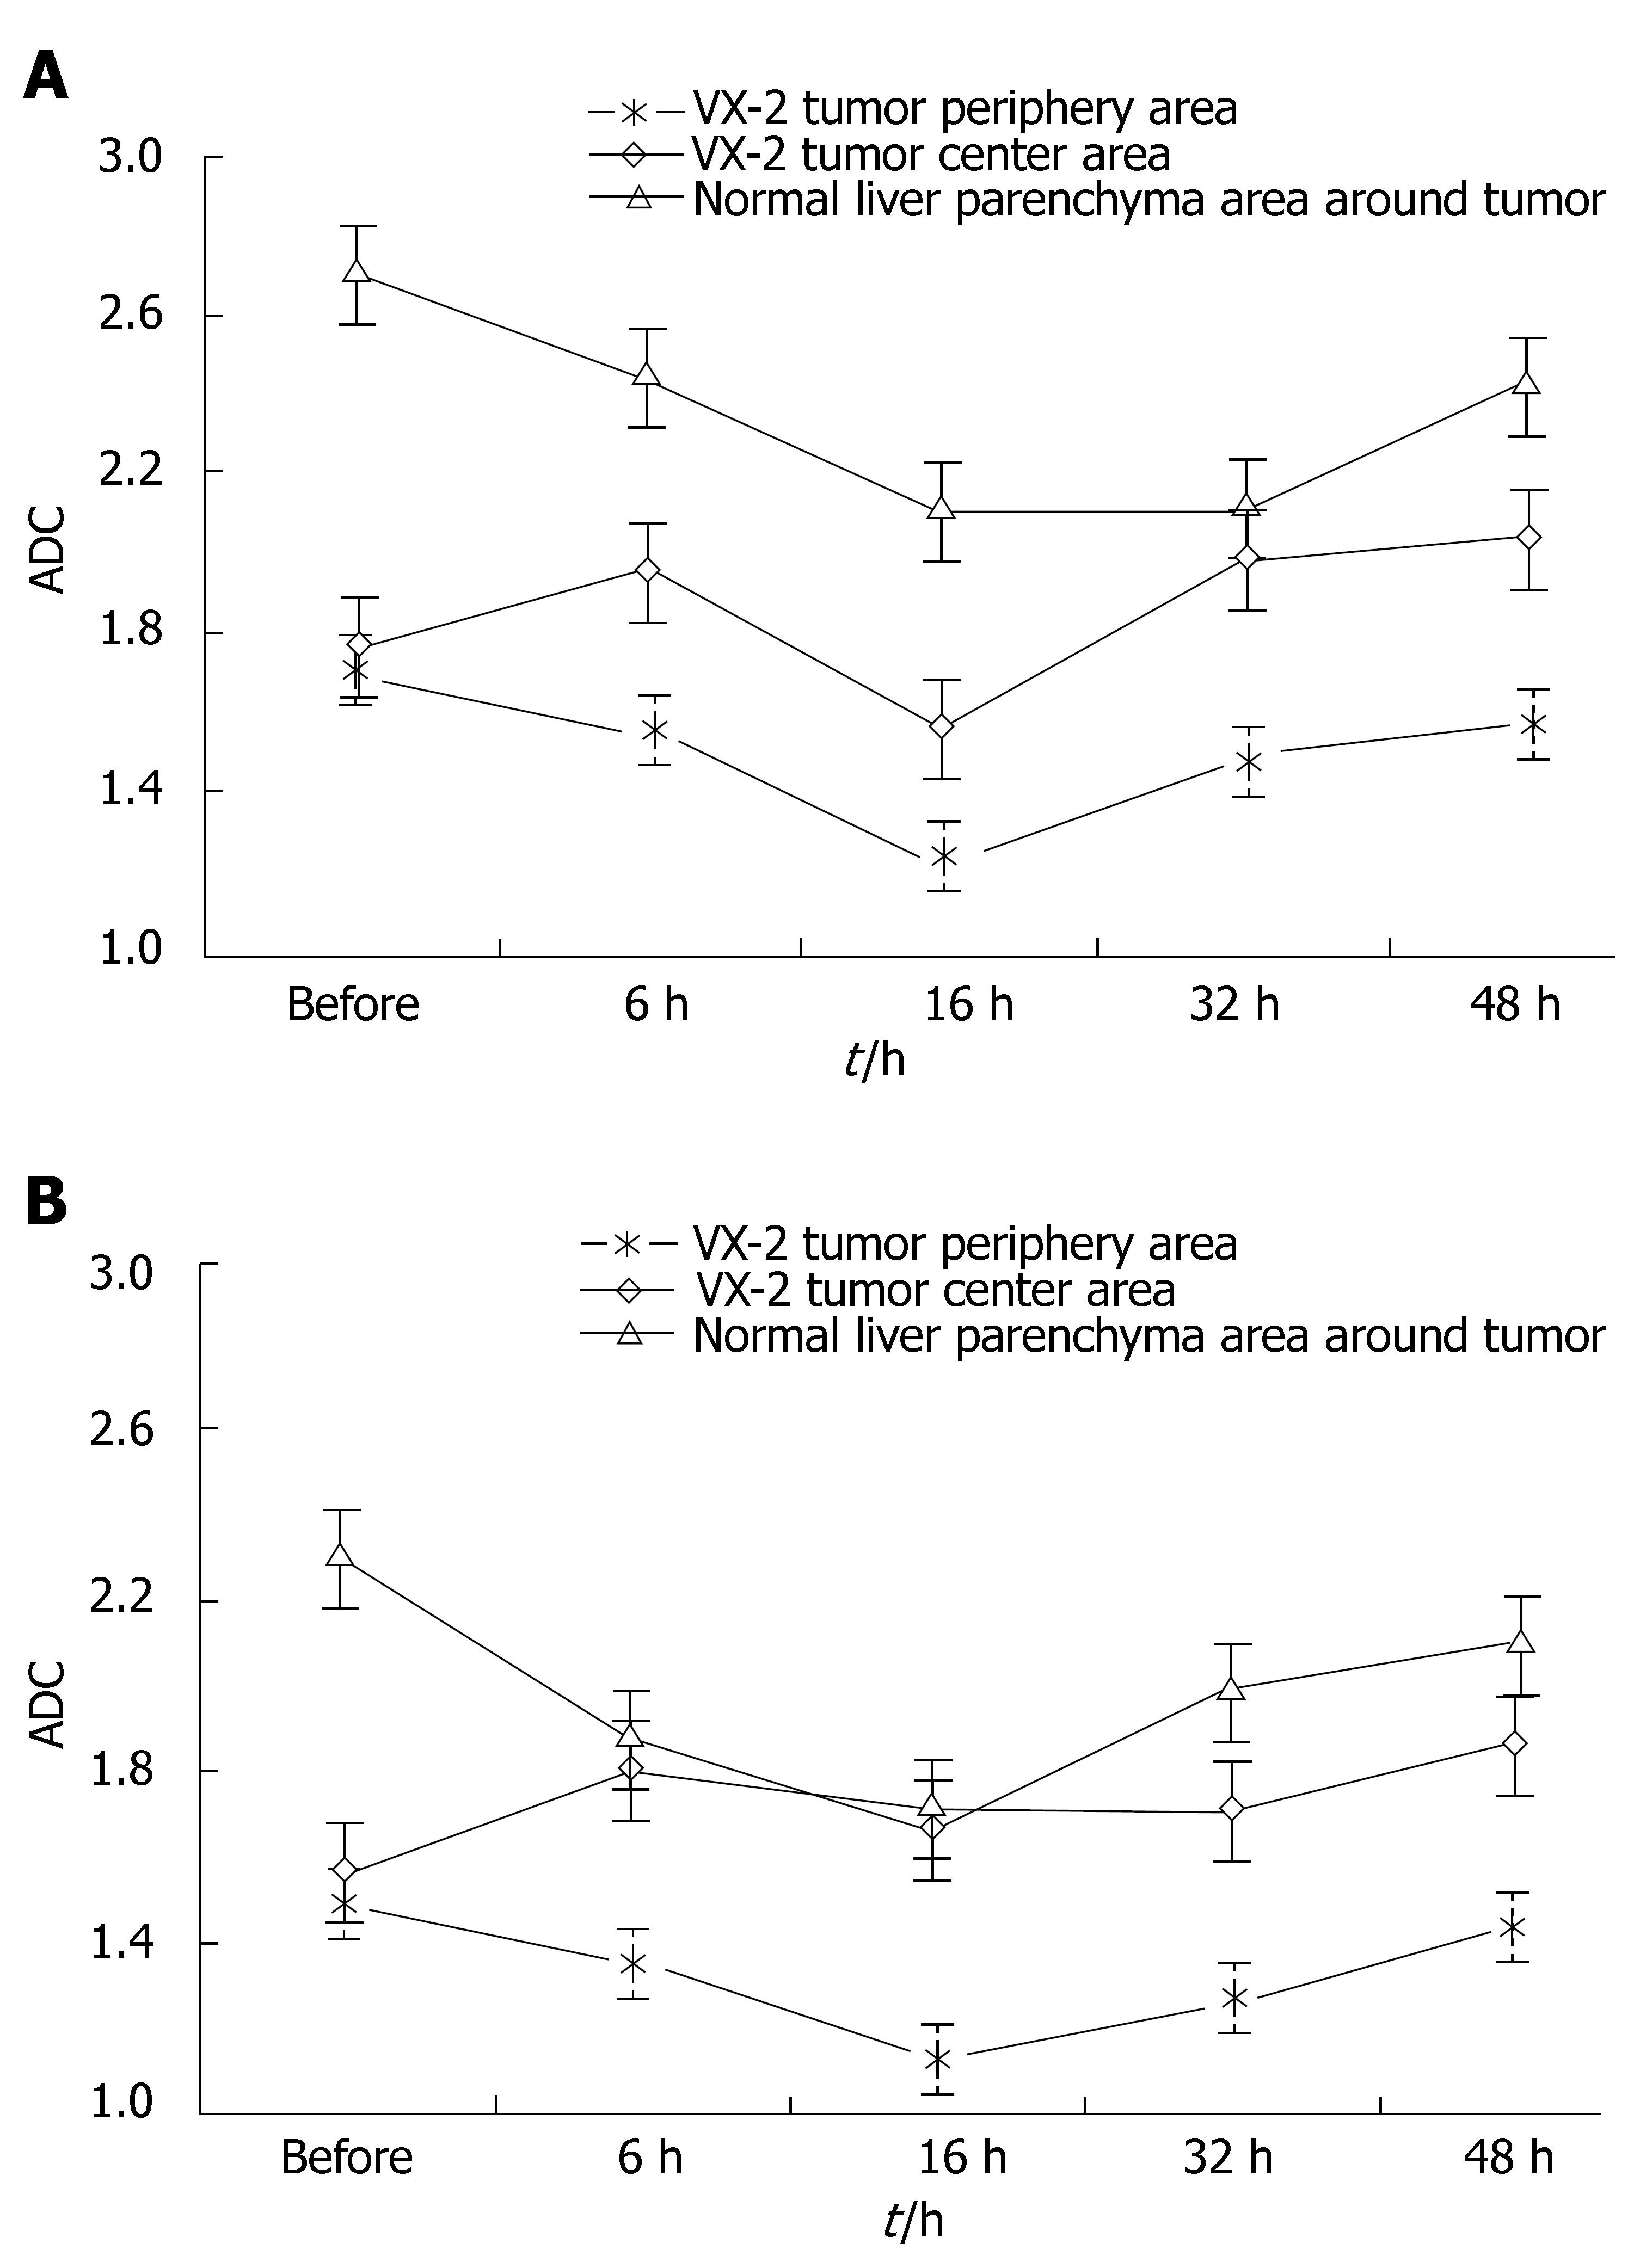
Figure 2 ADC values of different areas on DWI after chemoembolization.
A: B-value was 100 s/mm2; B: B-value was 300 s/mm2.
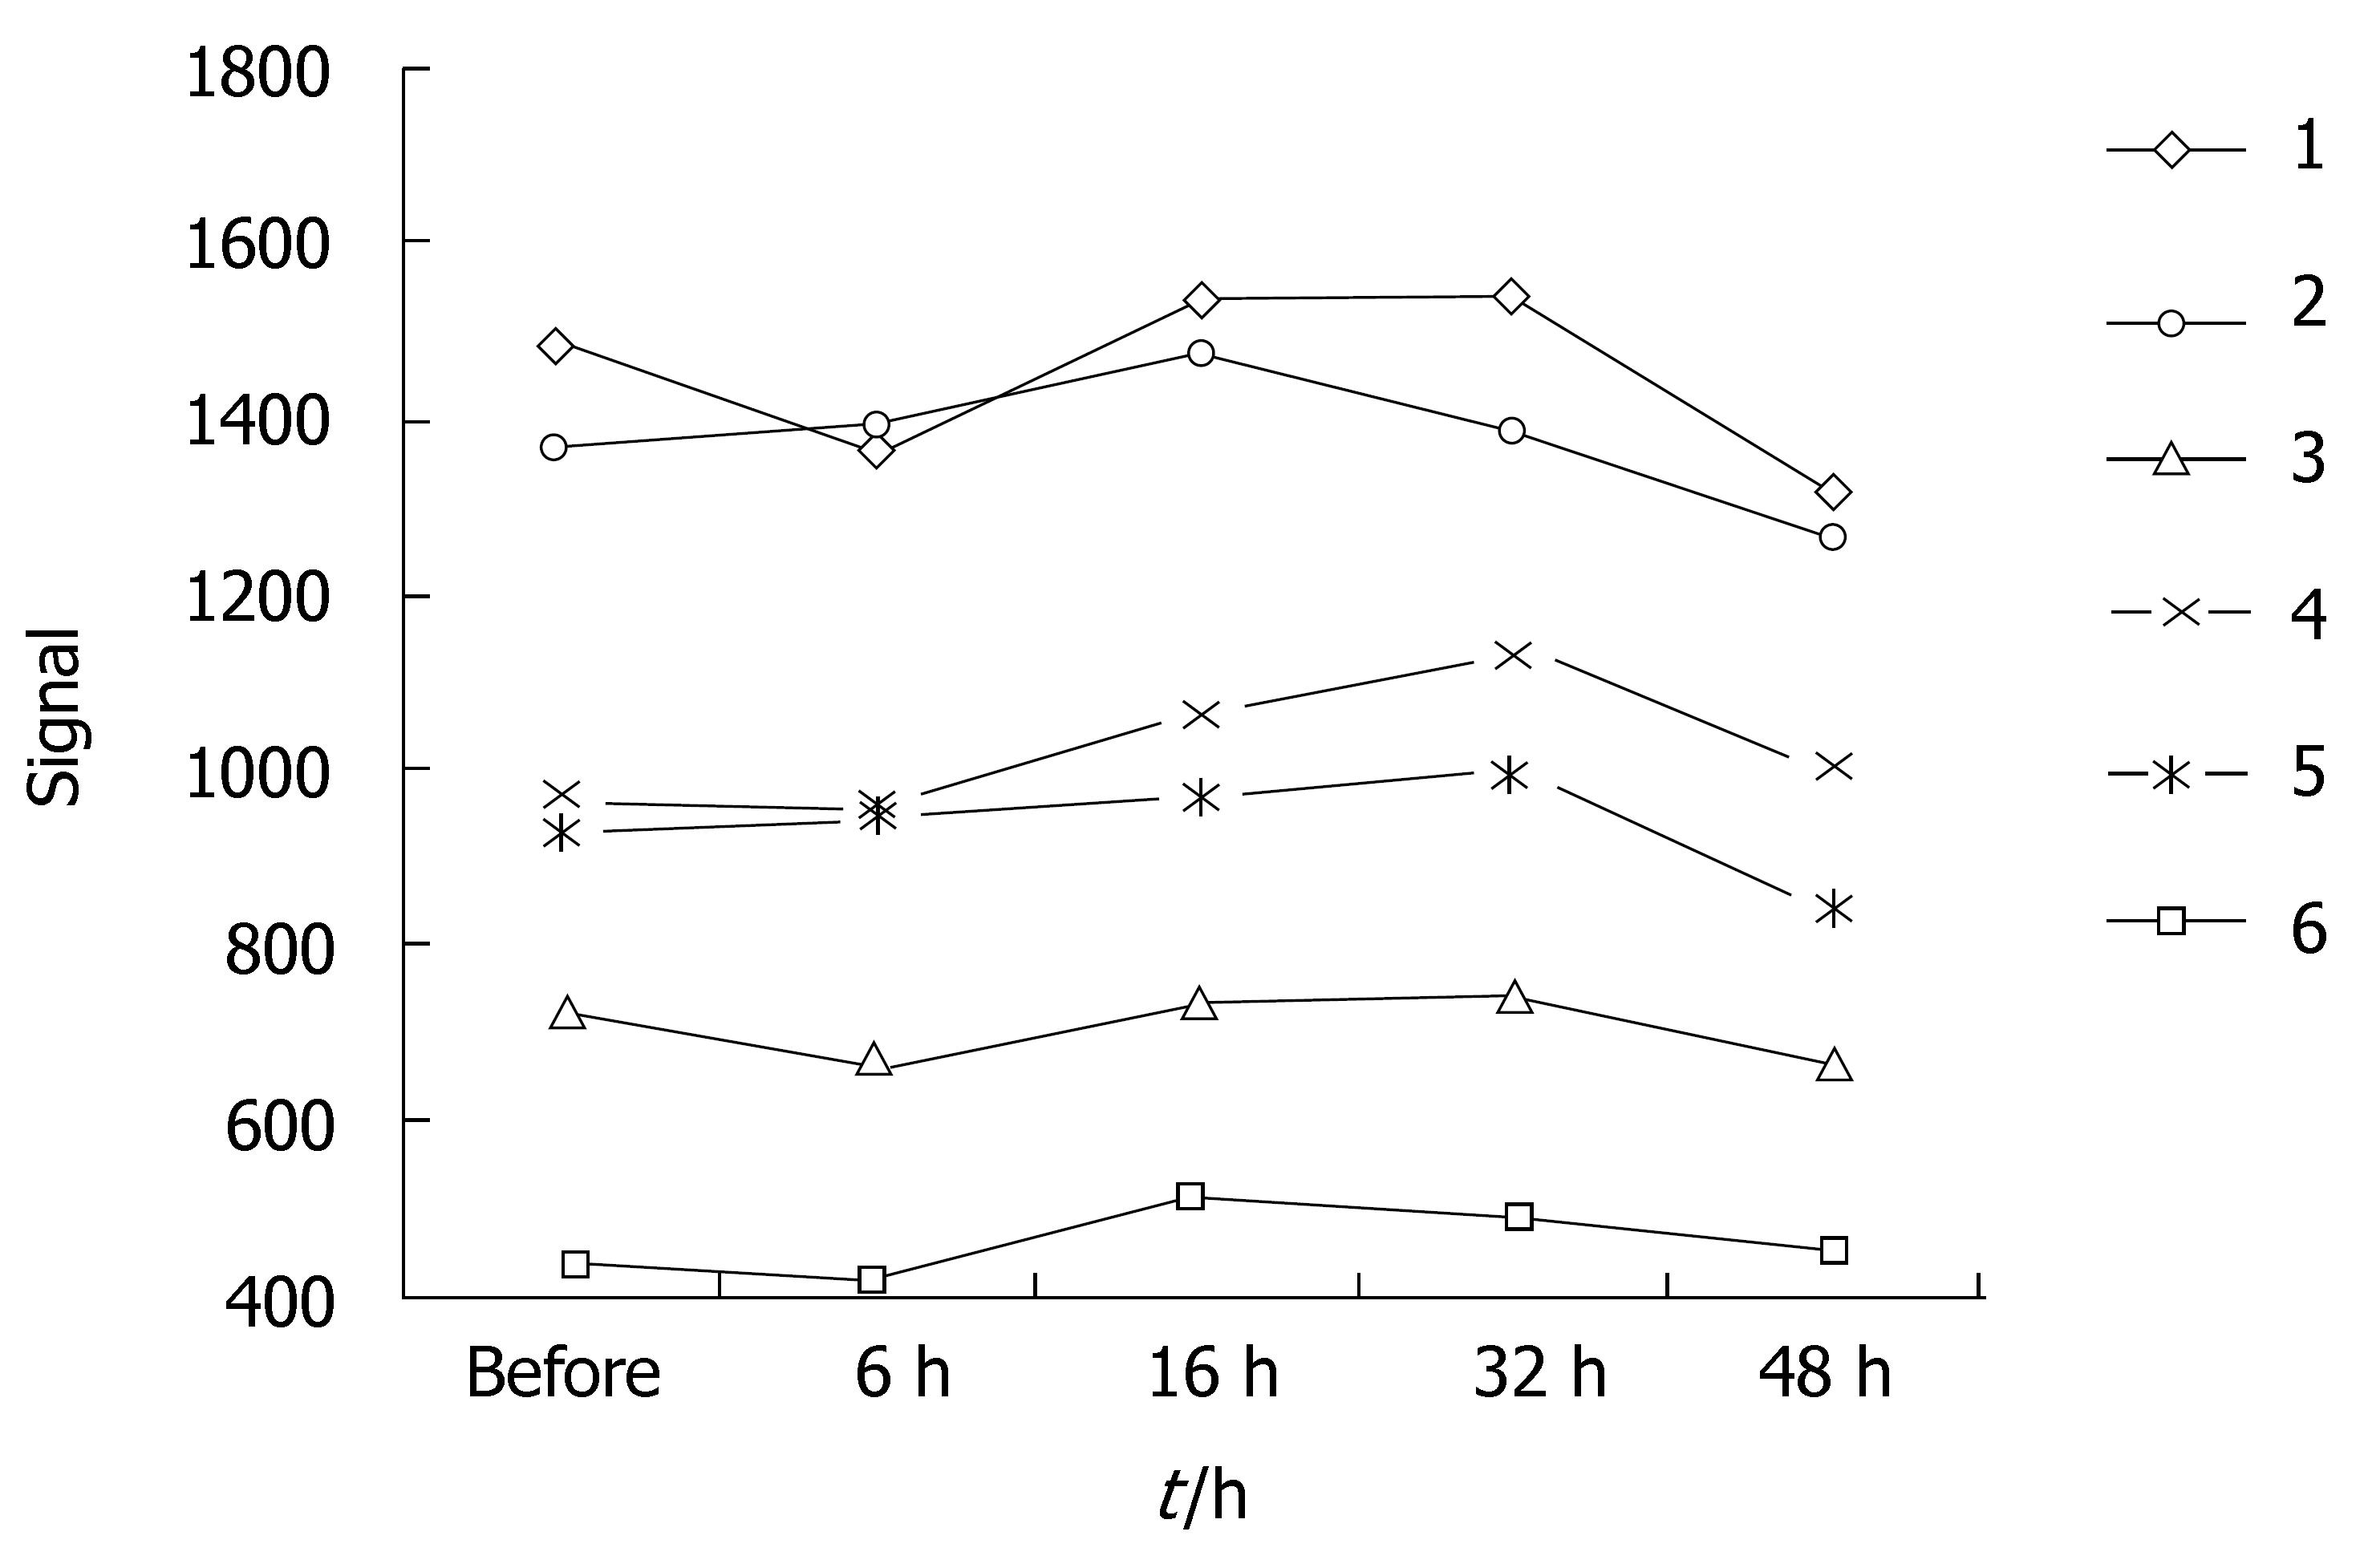
Figure 3 Signal values on DWI when area and b-value was different after chemoembolization.
Areas: 1-signal of VX-2 tumor periphery area when b-value was 100 s/mm2; 2-signal of VX-2 tumor center area when b-value was 100 s/mm2; 3-signal of the normal liver parenchyma area around tumor when b-value was 100 s/mm2; 4-signal of VX-2 tumor periphery area when b-value was 300 s/mm2; 5-signal of VX-2 tumor center area when b-value was 300 s/mm2; 6-signal of the normal liver parenchyma area around tumor when b-value was 300 s/mm2.
Figure 4 Image manifestations of hepatic VX-2 tumor on DWI and ADC map when b-value was 100 s/mm2 at 6 h after chemoembolization A: High signal and distinct margin of VX-2 tumor on DWI; B: Low signal of it on the ADC map.
Figure 5 Image manifestations of hepatic VX-2 tumor on DWI and ADC map when b-value was 100 s/mm2 at 48 h after chemoembolization A: High and uneven signal and distinct margin of VX-2 tumor on DWI; B: Low and uneven signal of it on the ADC map.
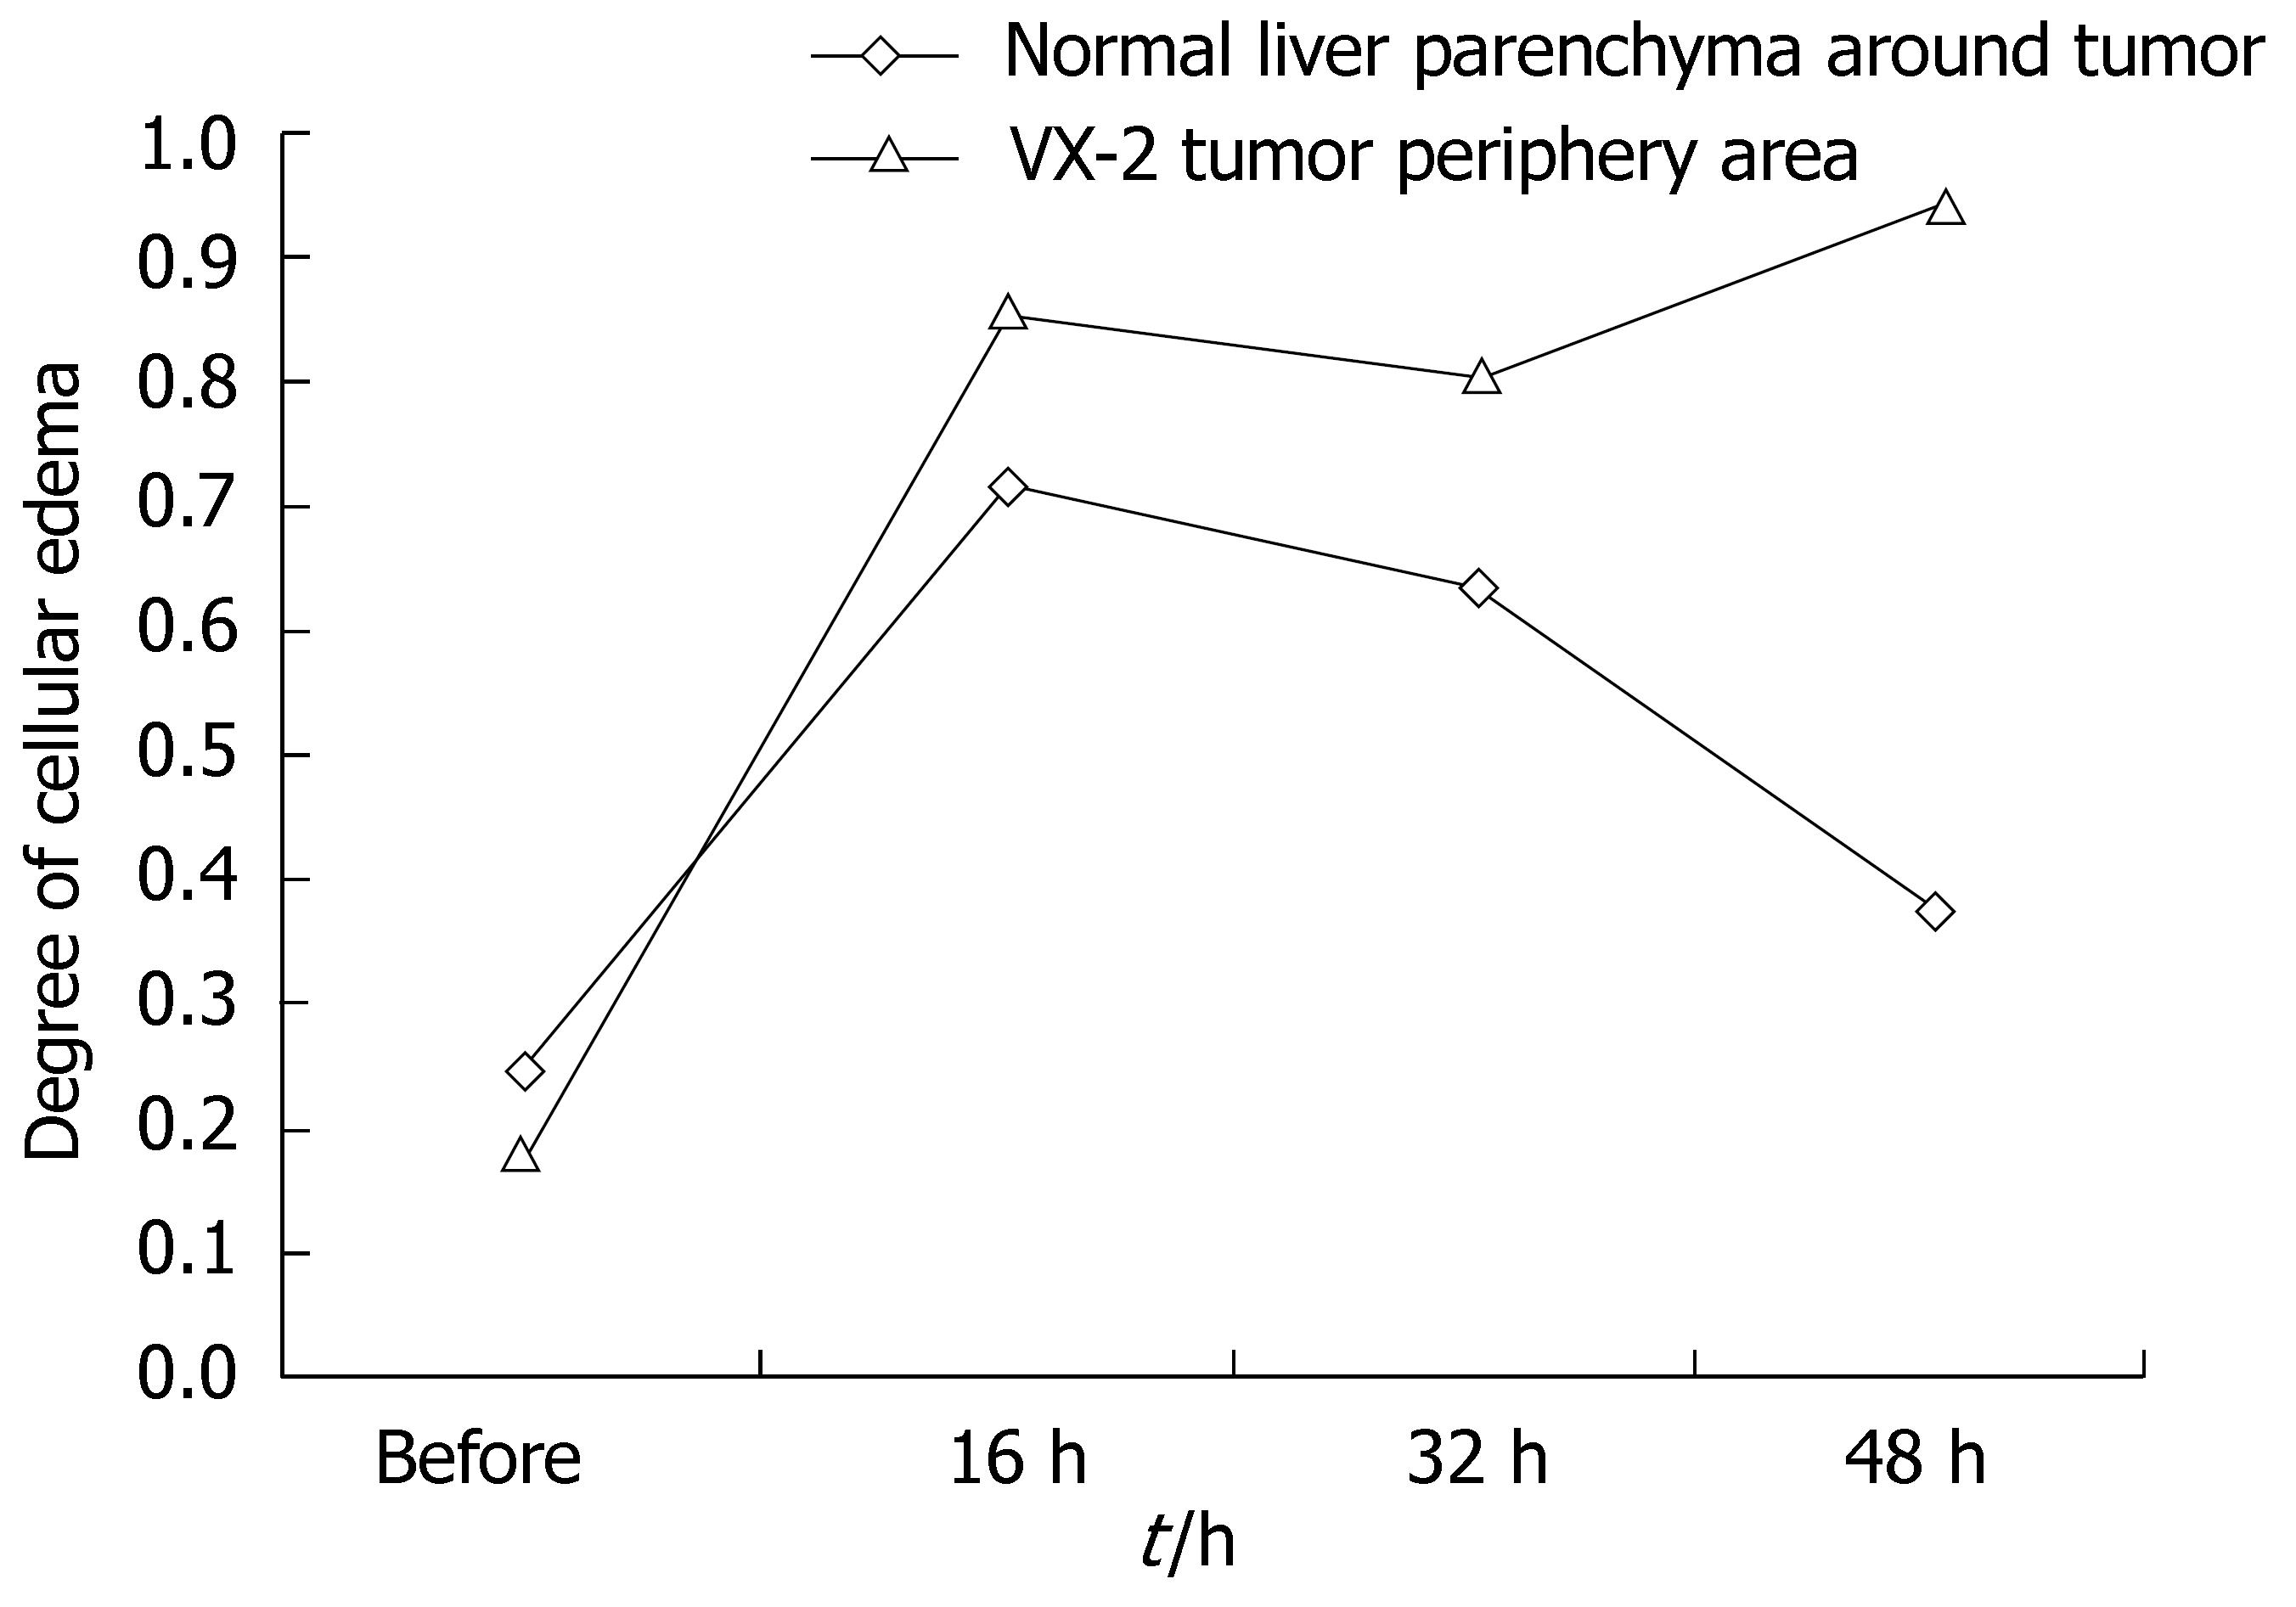
Figure 6 Cellular edema of different areas after chemoembolization.
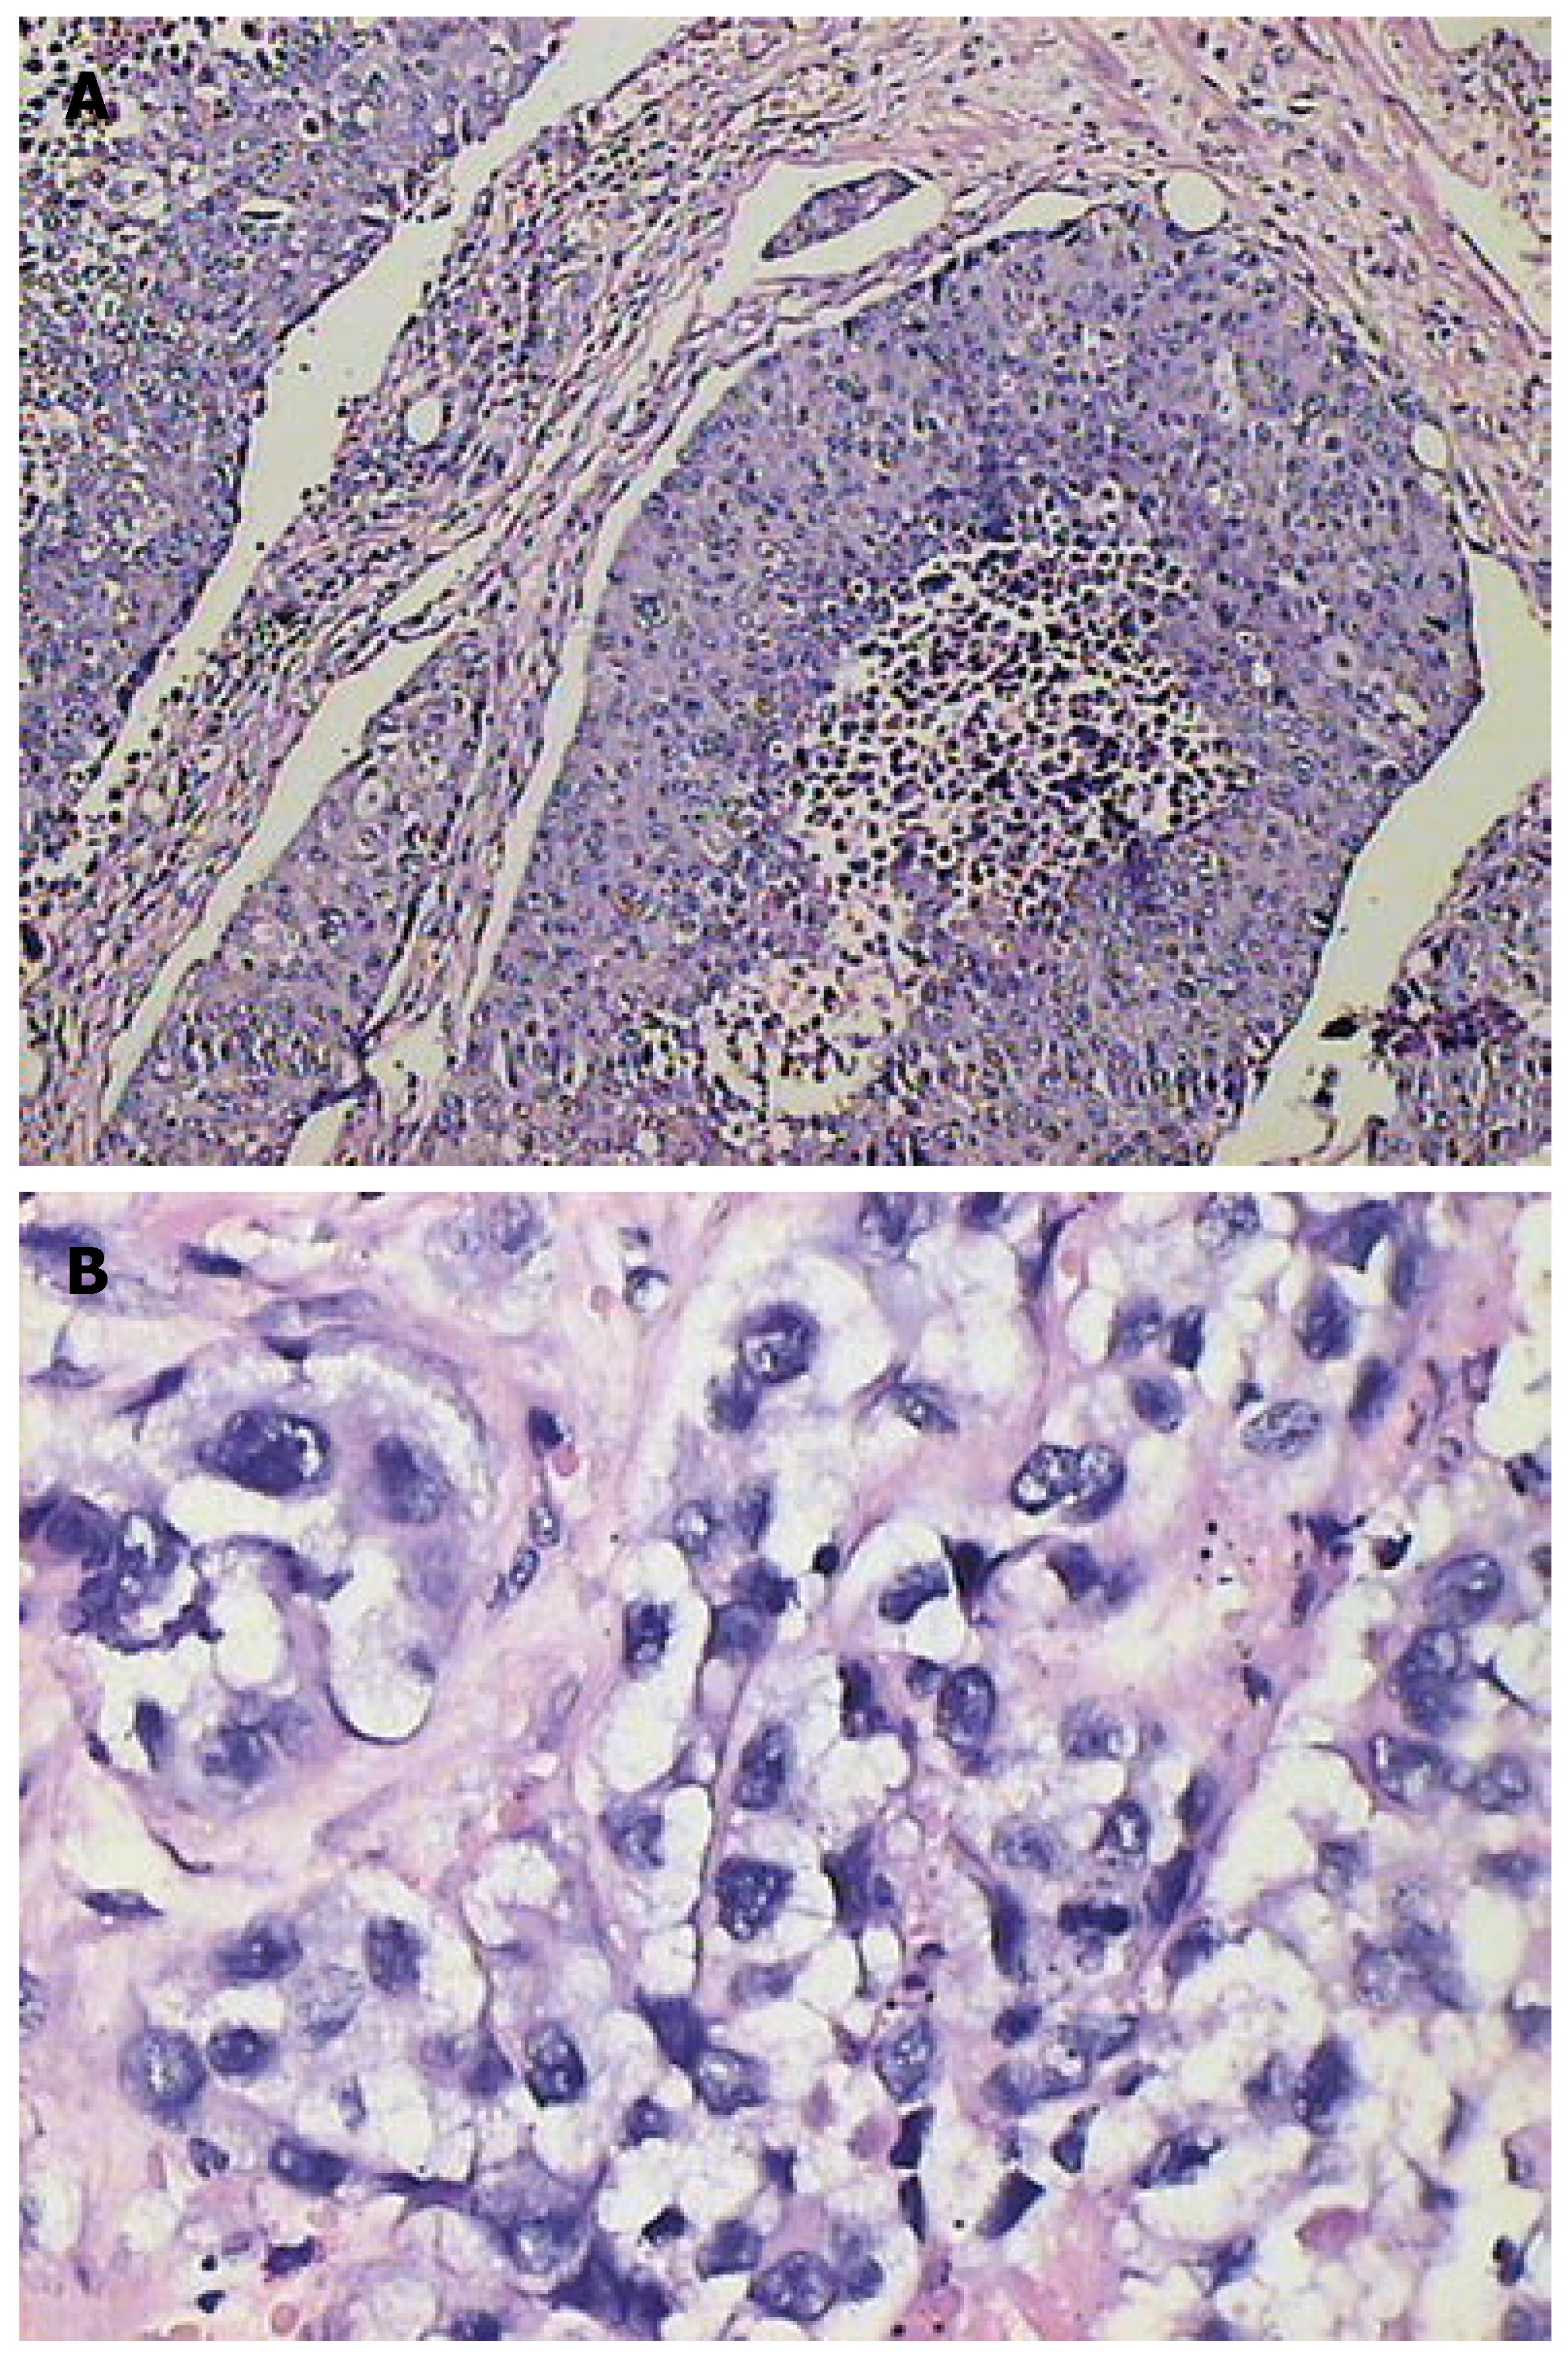
Figure 7 A: Cell nest of VX-2 tumor and wide zone of necrosis in the tumor(x 100) and B: cellular edema in the VX-2 tumor (x 400).
- Citation: Yuan YH, Xiao EH, Liu JB, He Z, Jin K, Ma C, Xiang J, Xiao JH, Chen WJ. Characteristics and pathological mechanism on magnetic resonance diffusion-weighted imaging after chemoembolization in rabbit liver VX-2 tumor model. World J Gastroenterol 2007; 13(43): 5699-5706
- URL: https://www.wjgnet.com/1007-9327/full/v13/i43/5699.htm
- DOI: https://dx.doi.org/10.3748/wjg.v13.i43.5699


