Copyright
©2007 Baishideng Publishing Group Inc.
World J Gastroenterol. Nov 7, 2007; 13(41): 5481-5485
Published online Nov 7, 2007. doi: 10.3748/wjg.v13.i41.5481
Published online Nov 7, 2007. doi: 10.3748/wjg.v13.i41.5481
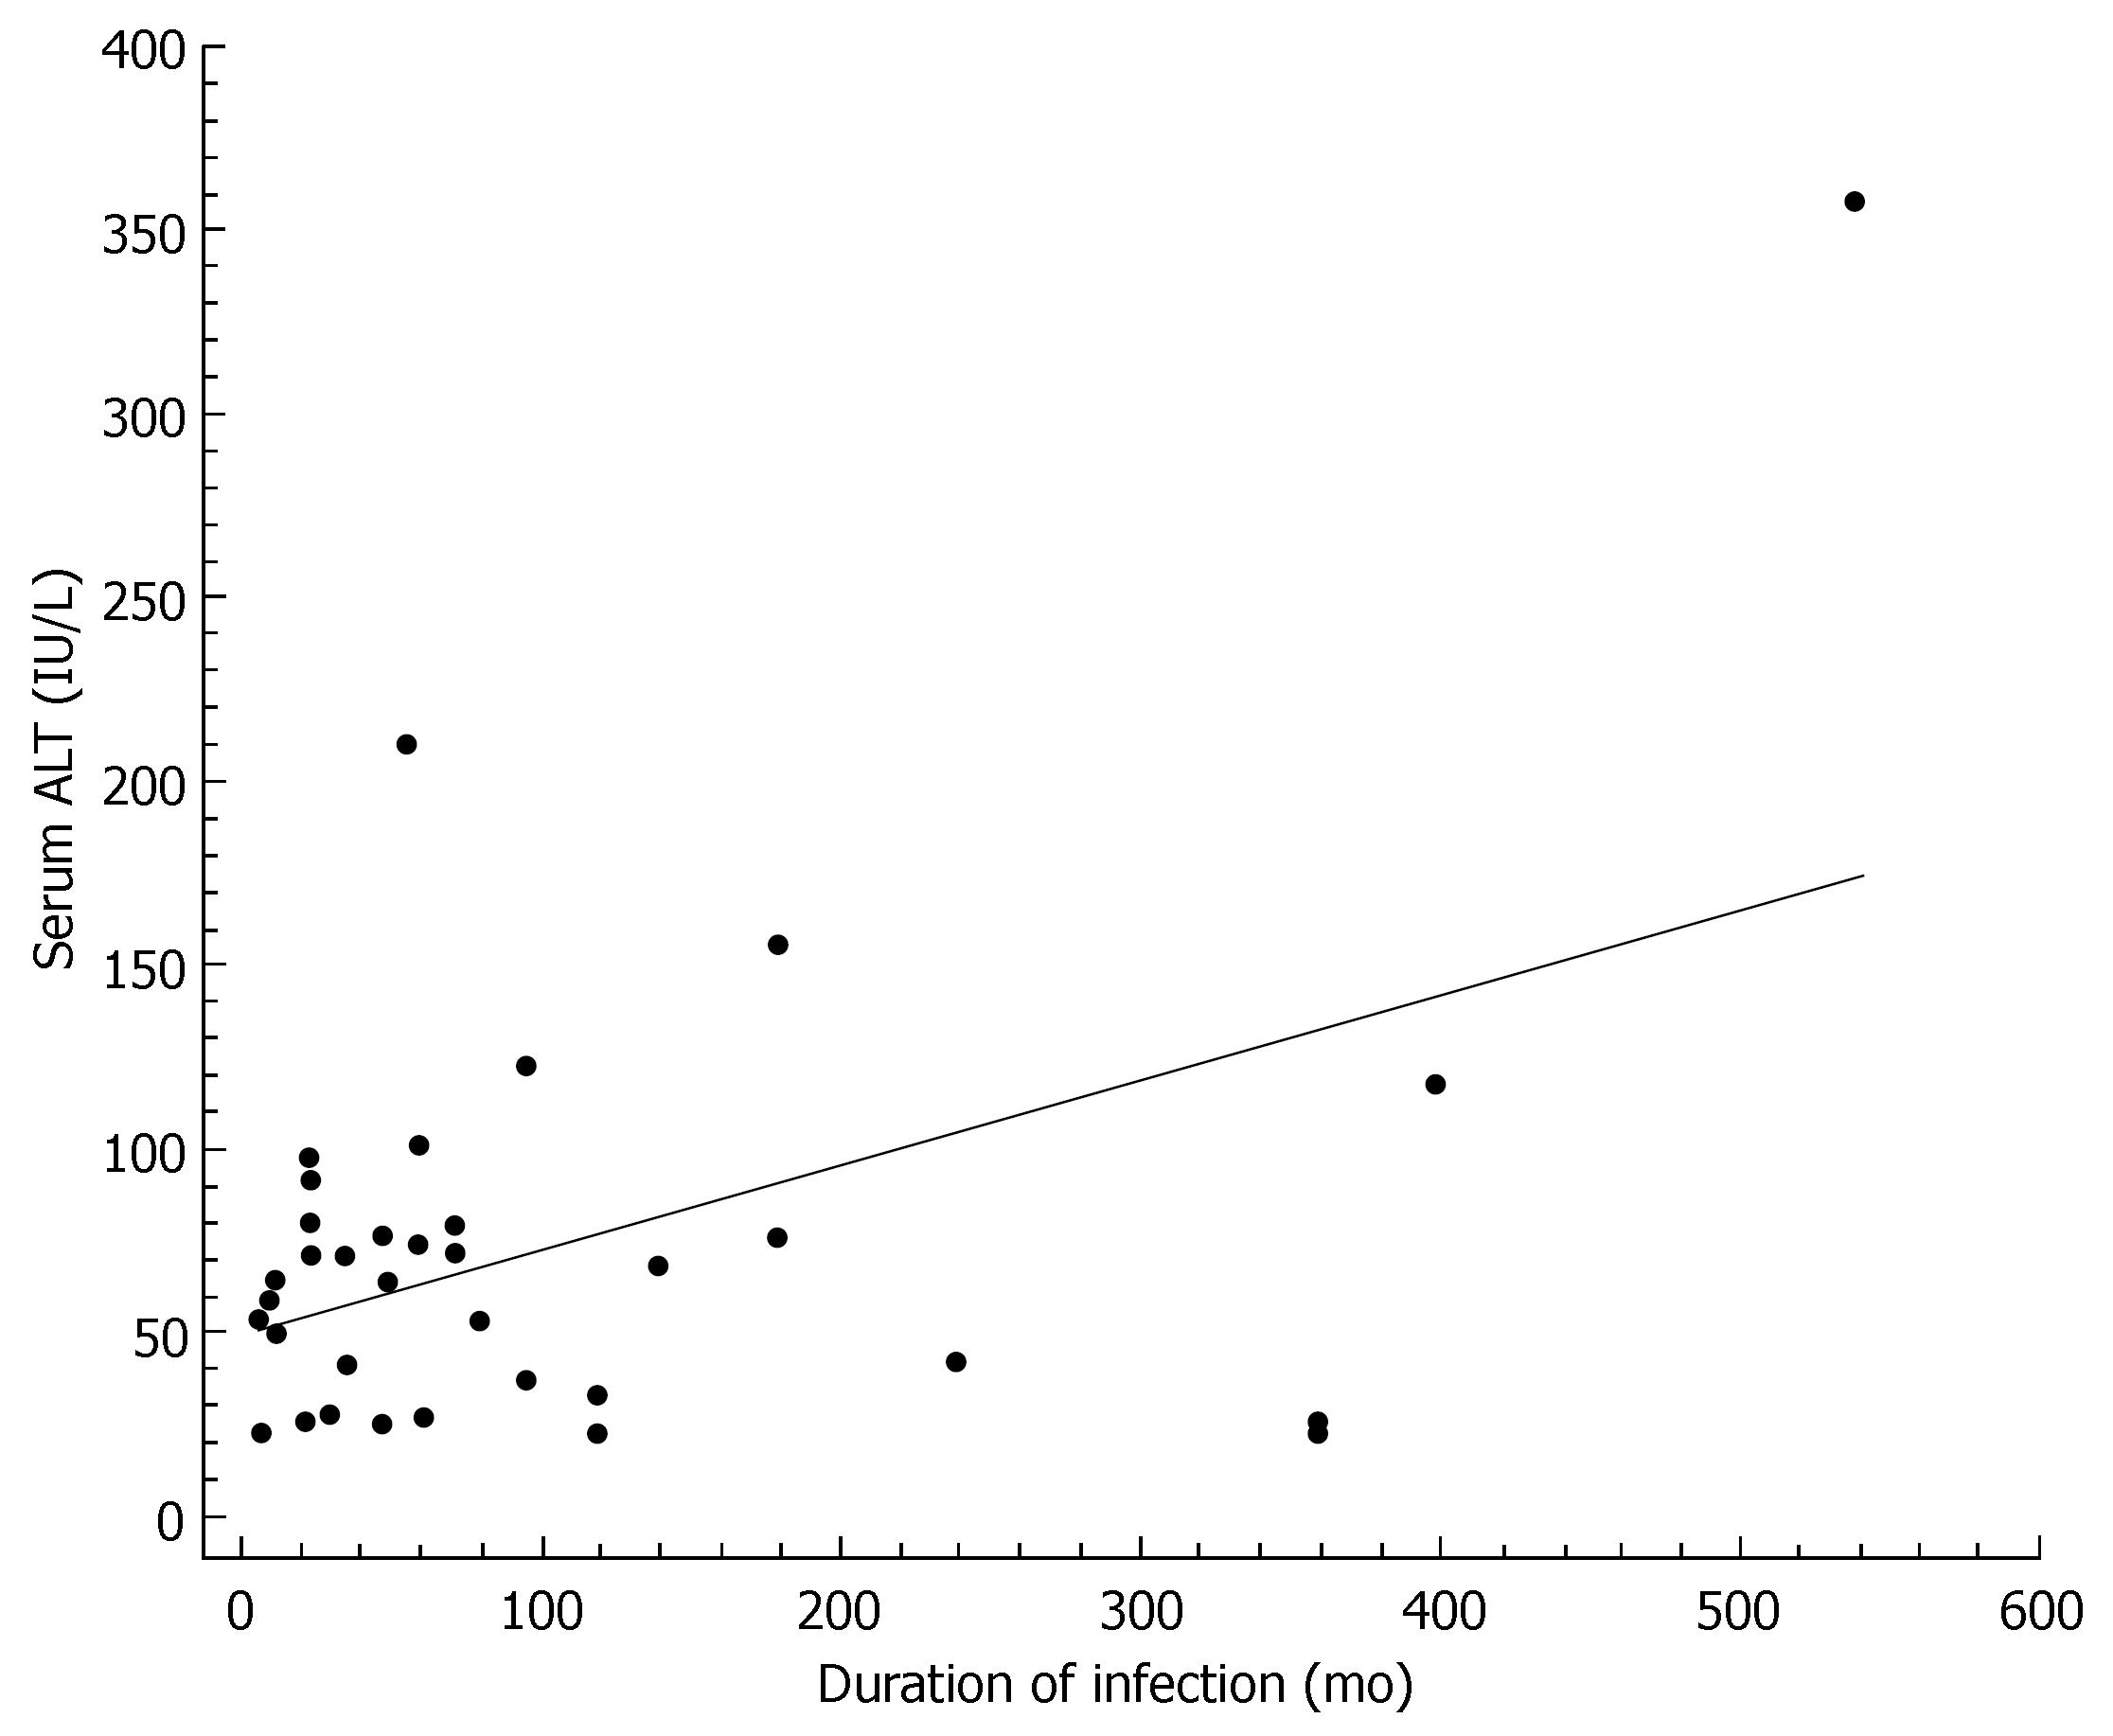
Figure 1 Scatter diagram and regression line showing a significant positive relationship between duration of HCV infection and serum alanine aminotransferase (r = 0.
46, P < 0.01).
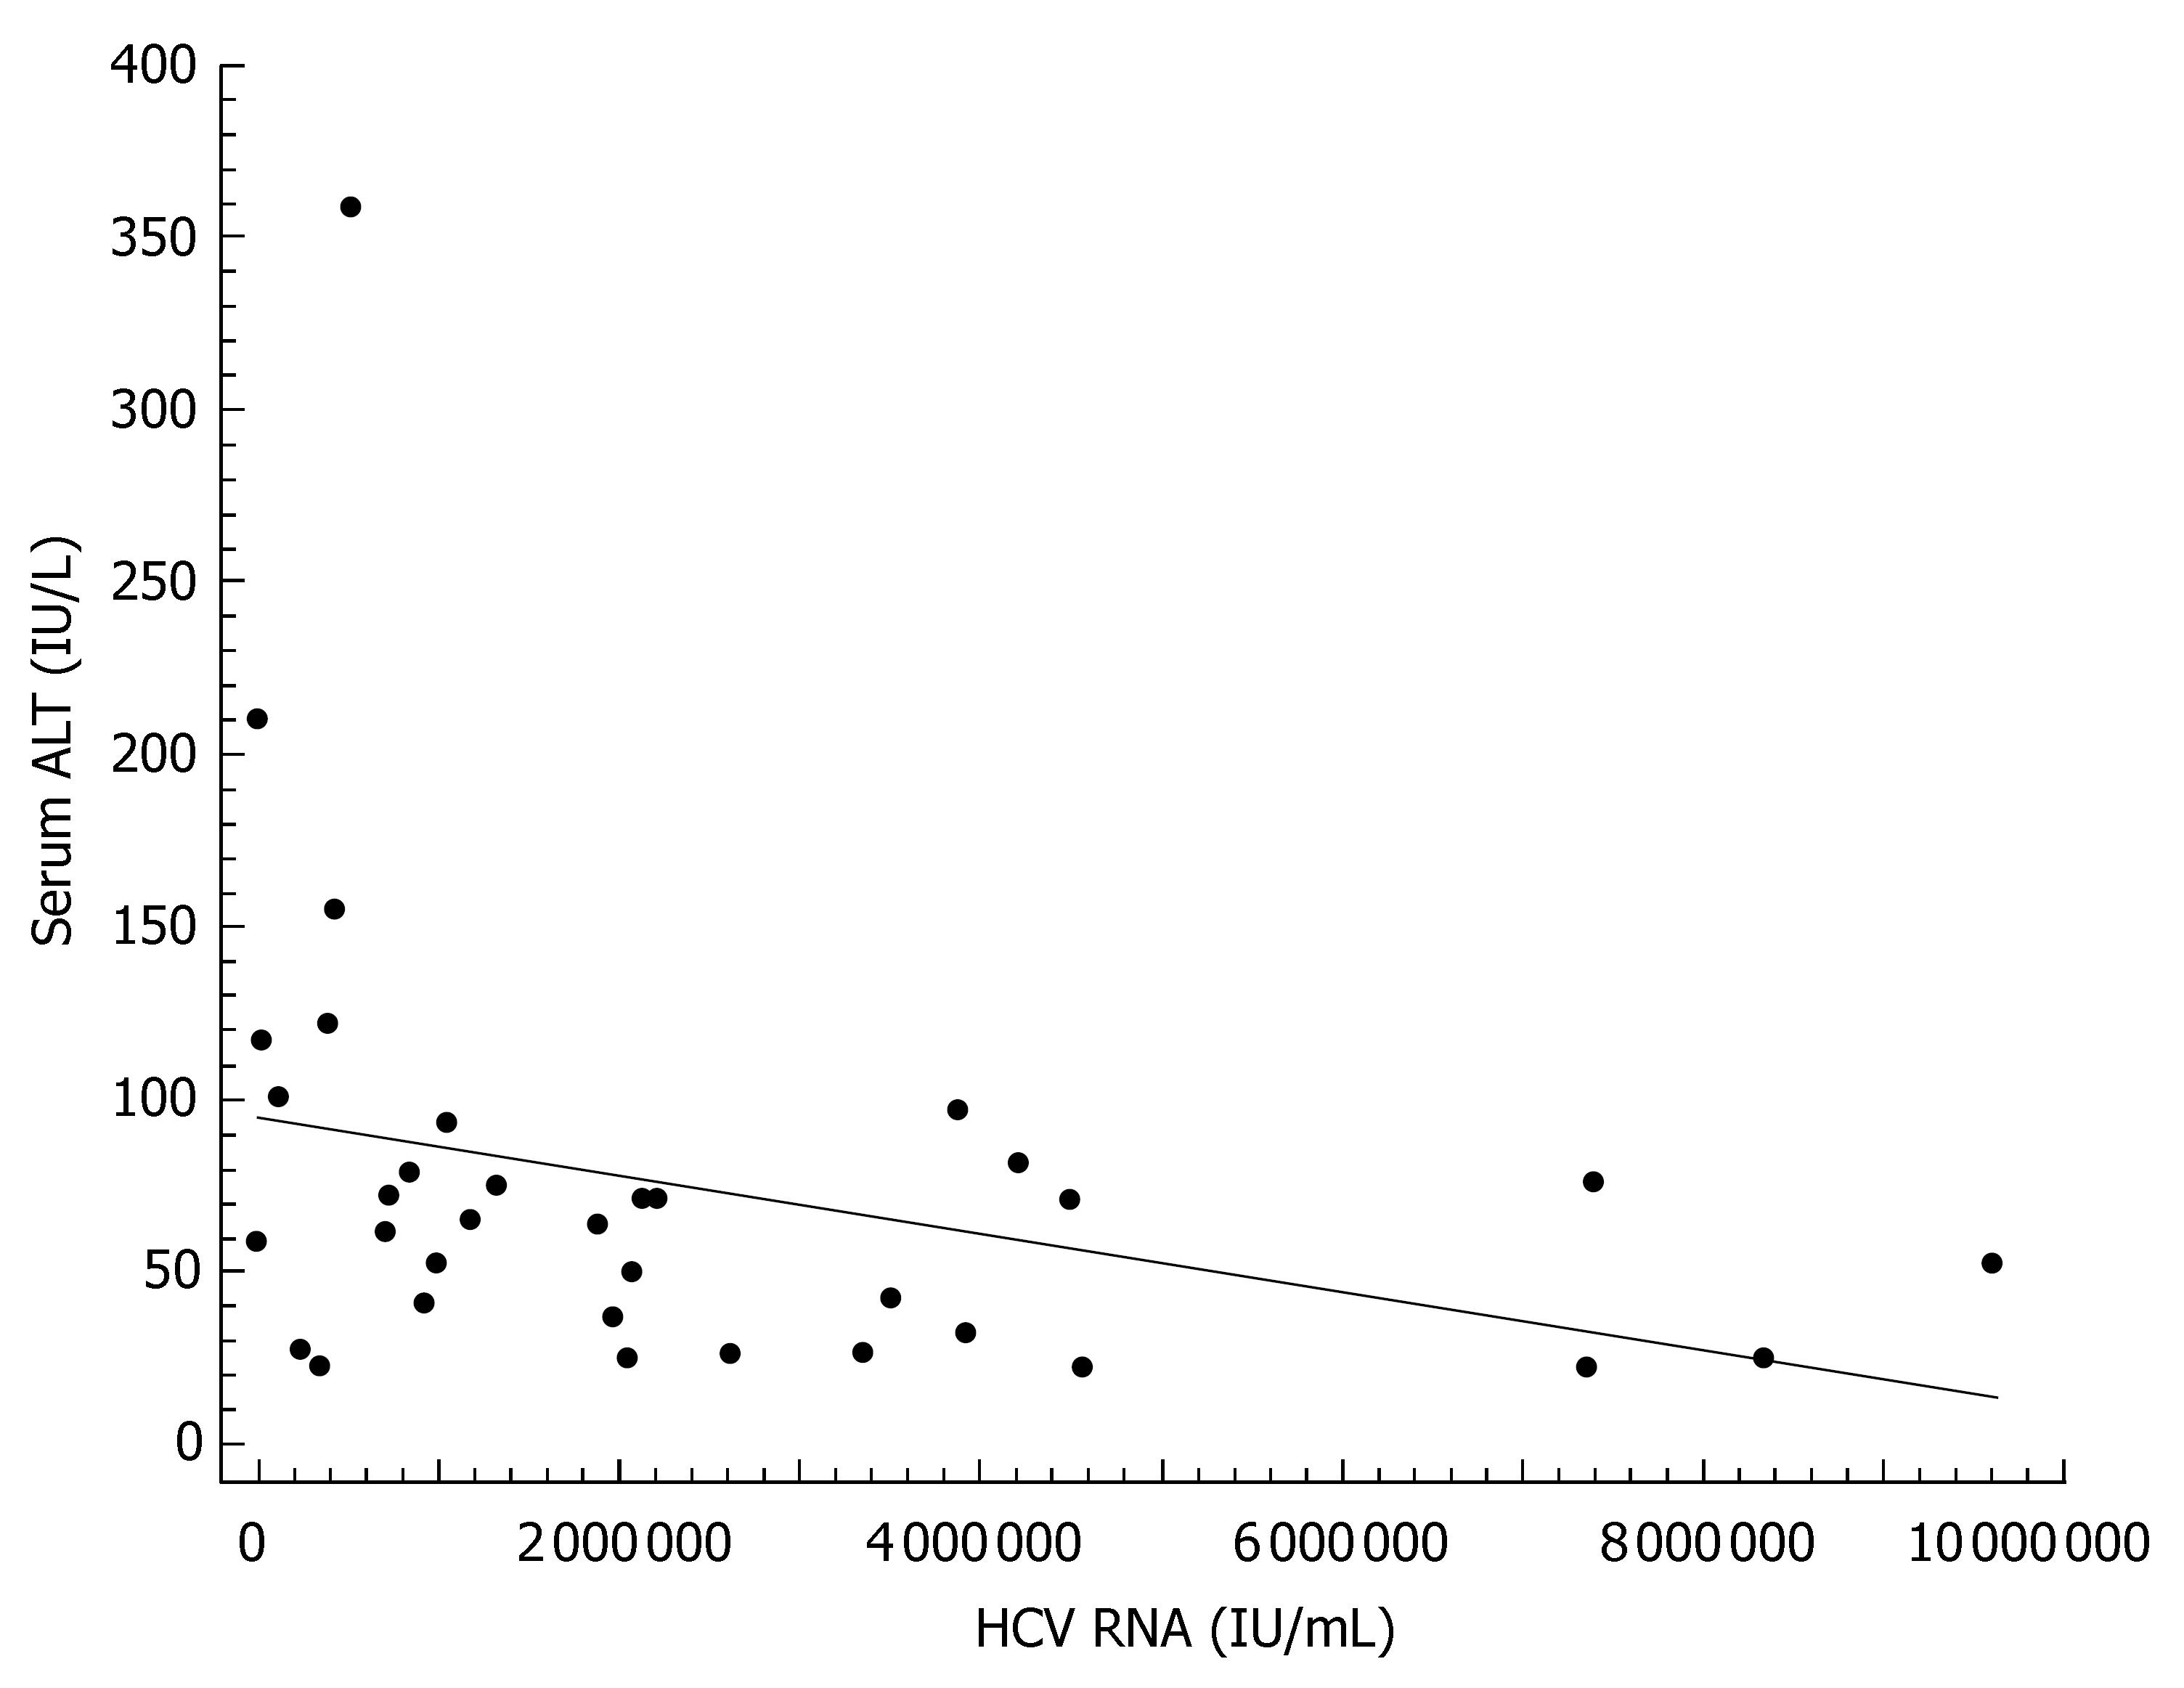
Figure 2 Scatter diagram and regression line showing a significant inverse relationship between viral load and serum alanine aminotransferase (r = -0.
33, P < 0.05).
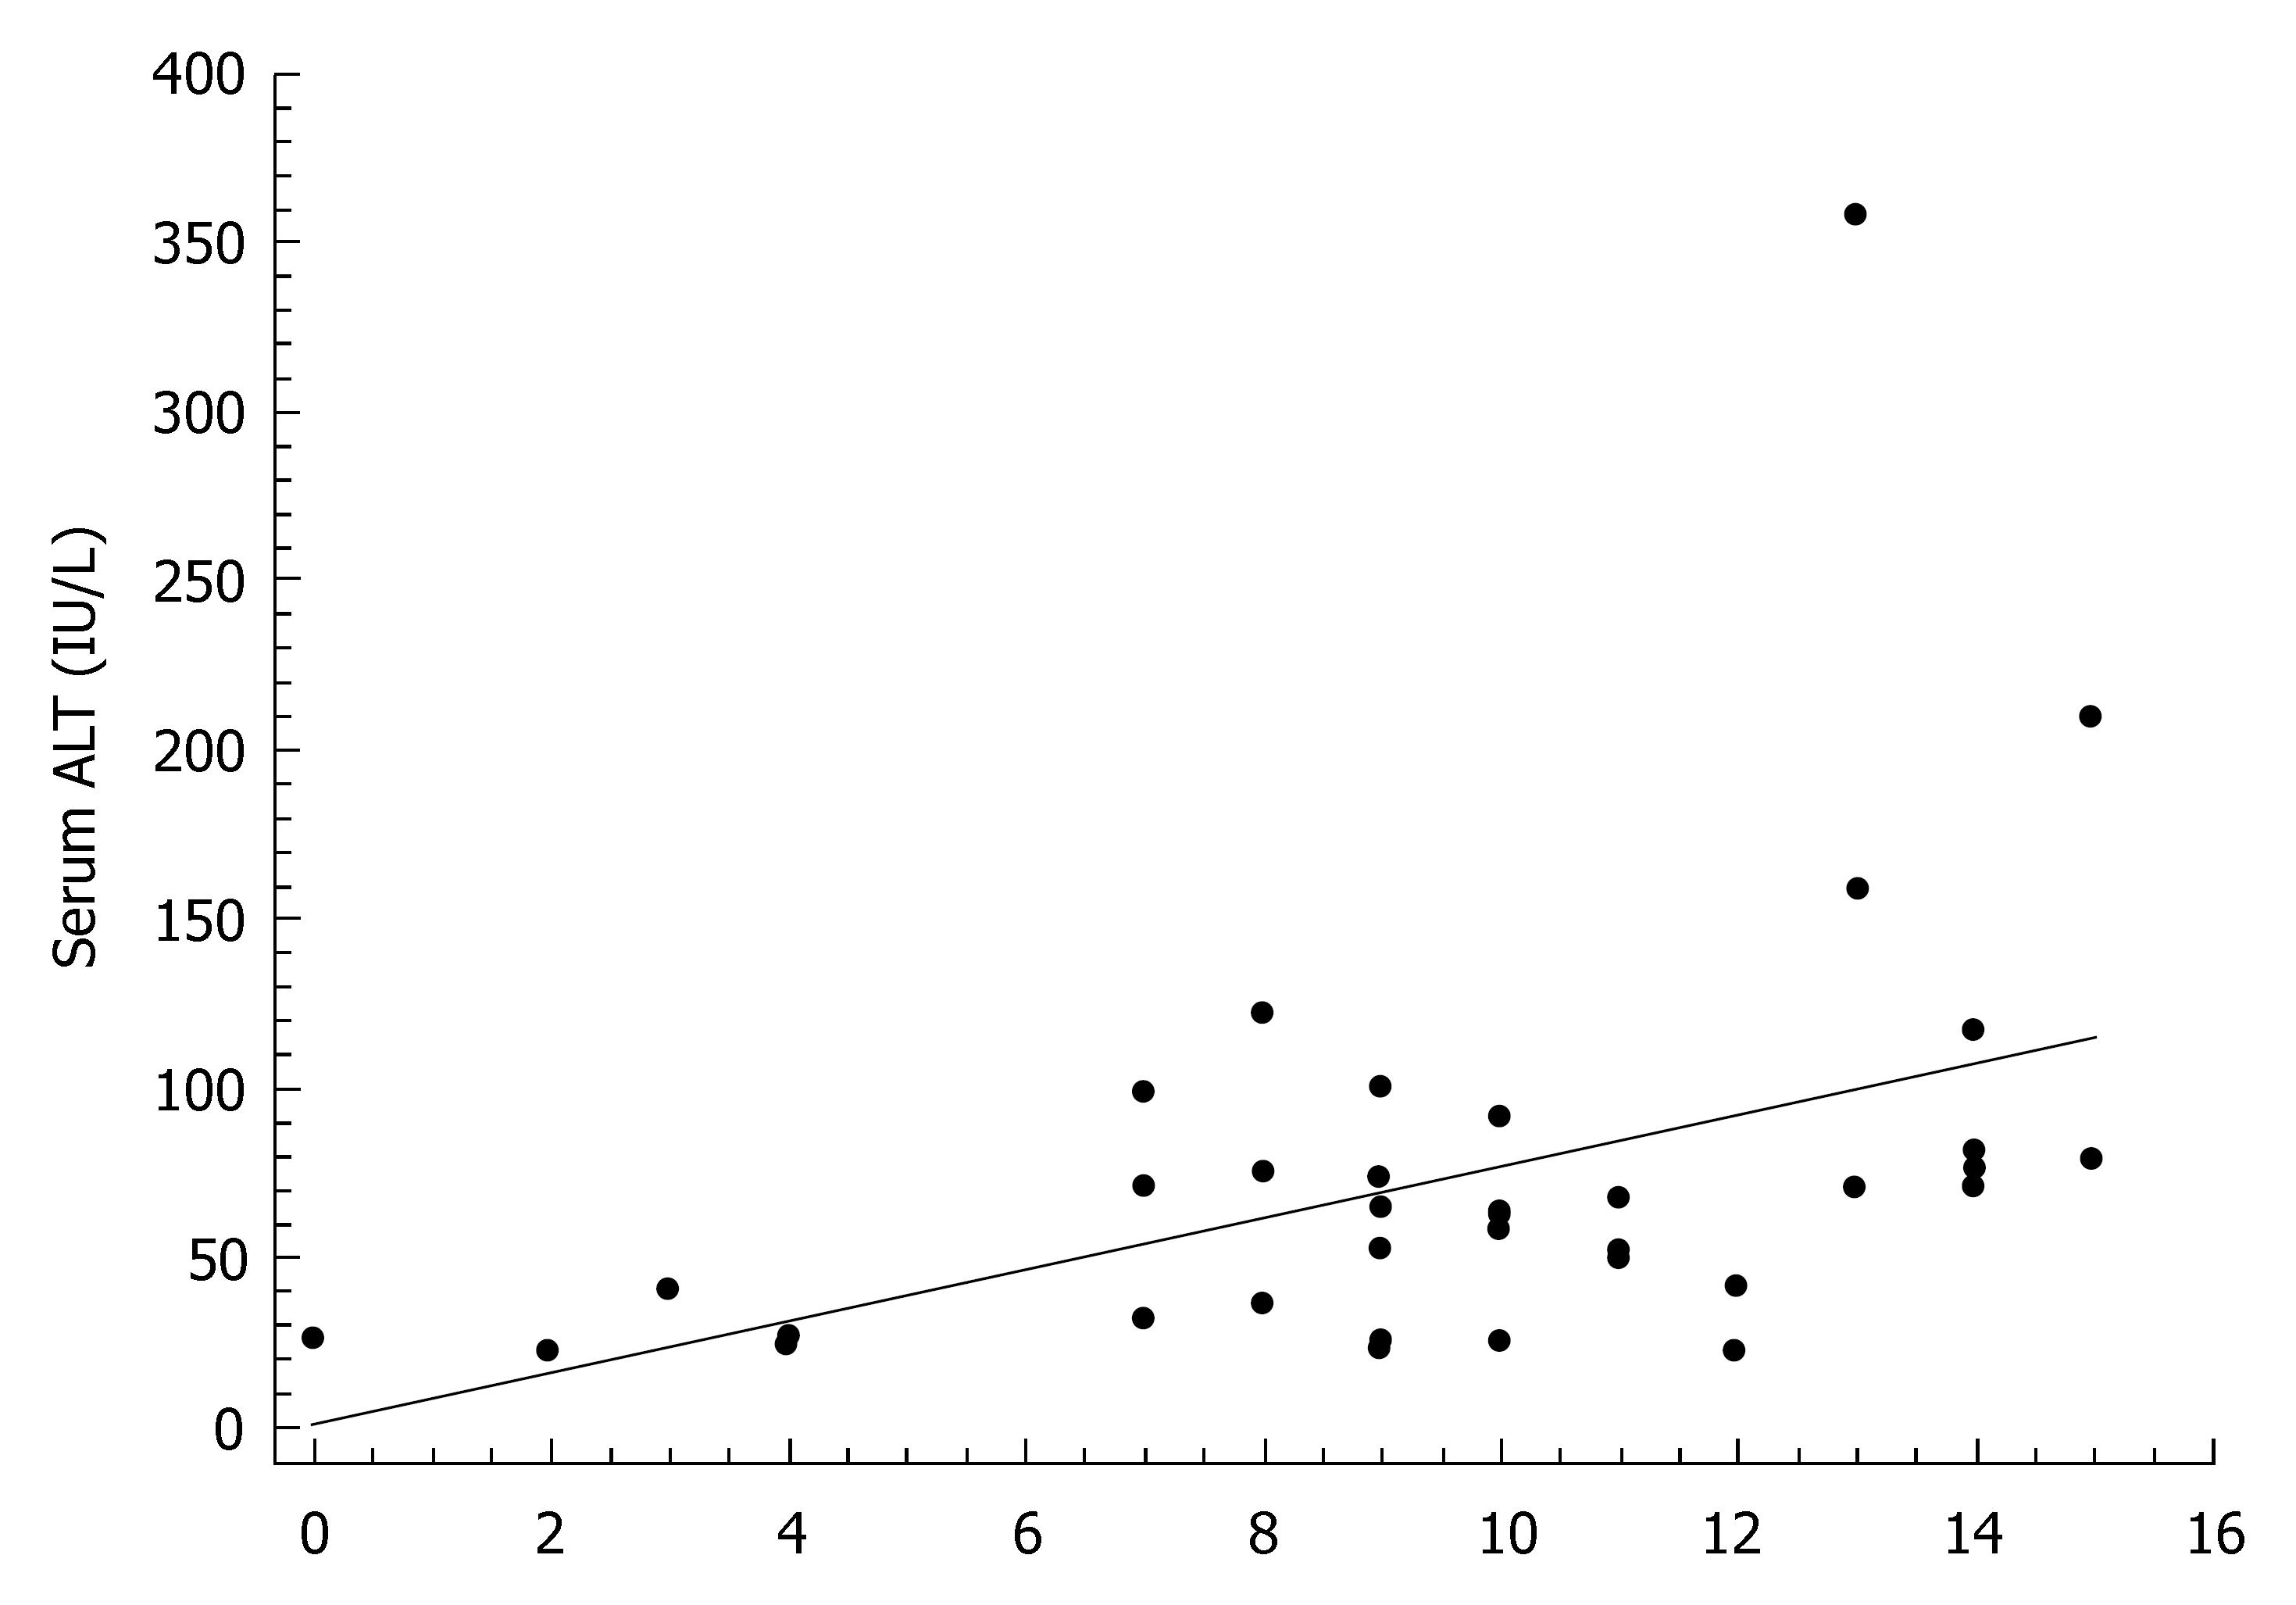
Figure 3 Scatter diagram and regression line showing a significant positive relationship between the Histology Activity Index and serum alanine aminotransferase (r = 0.
44, P < 0.01).
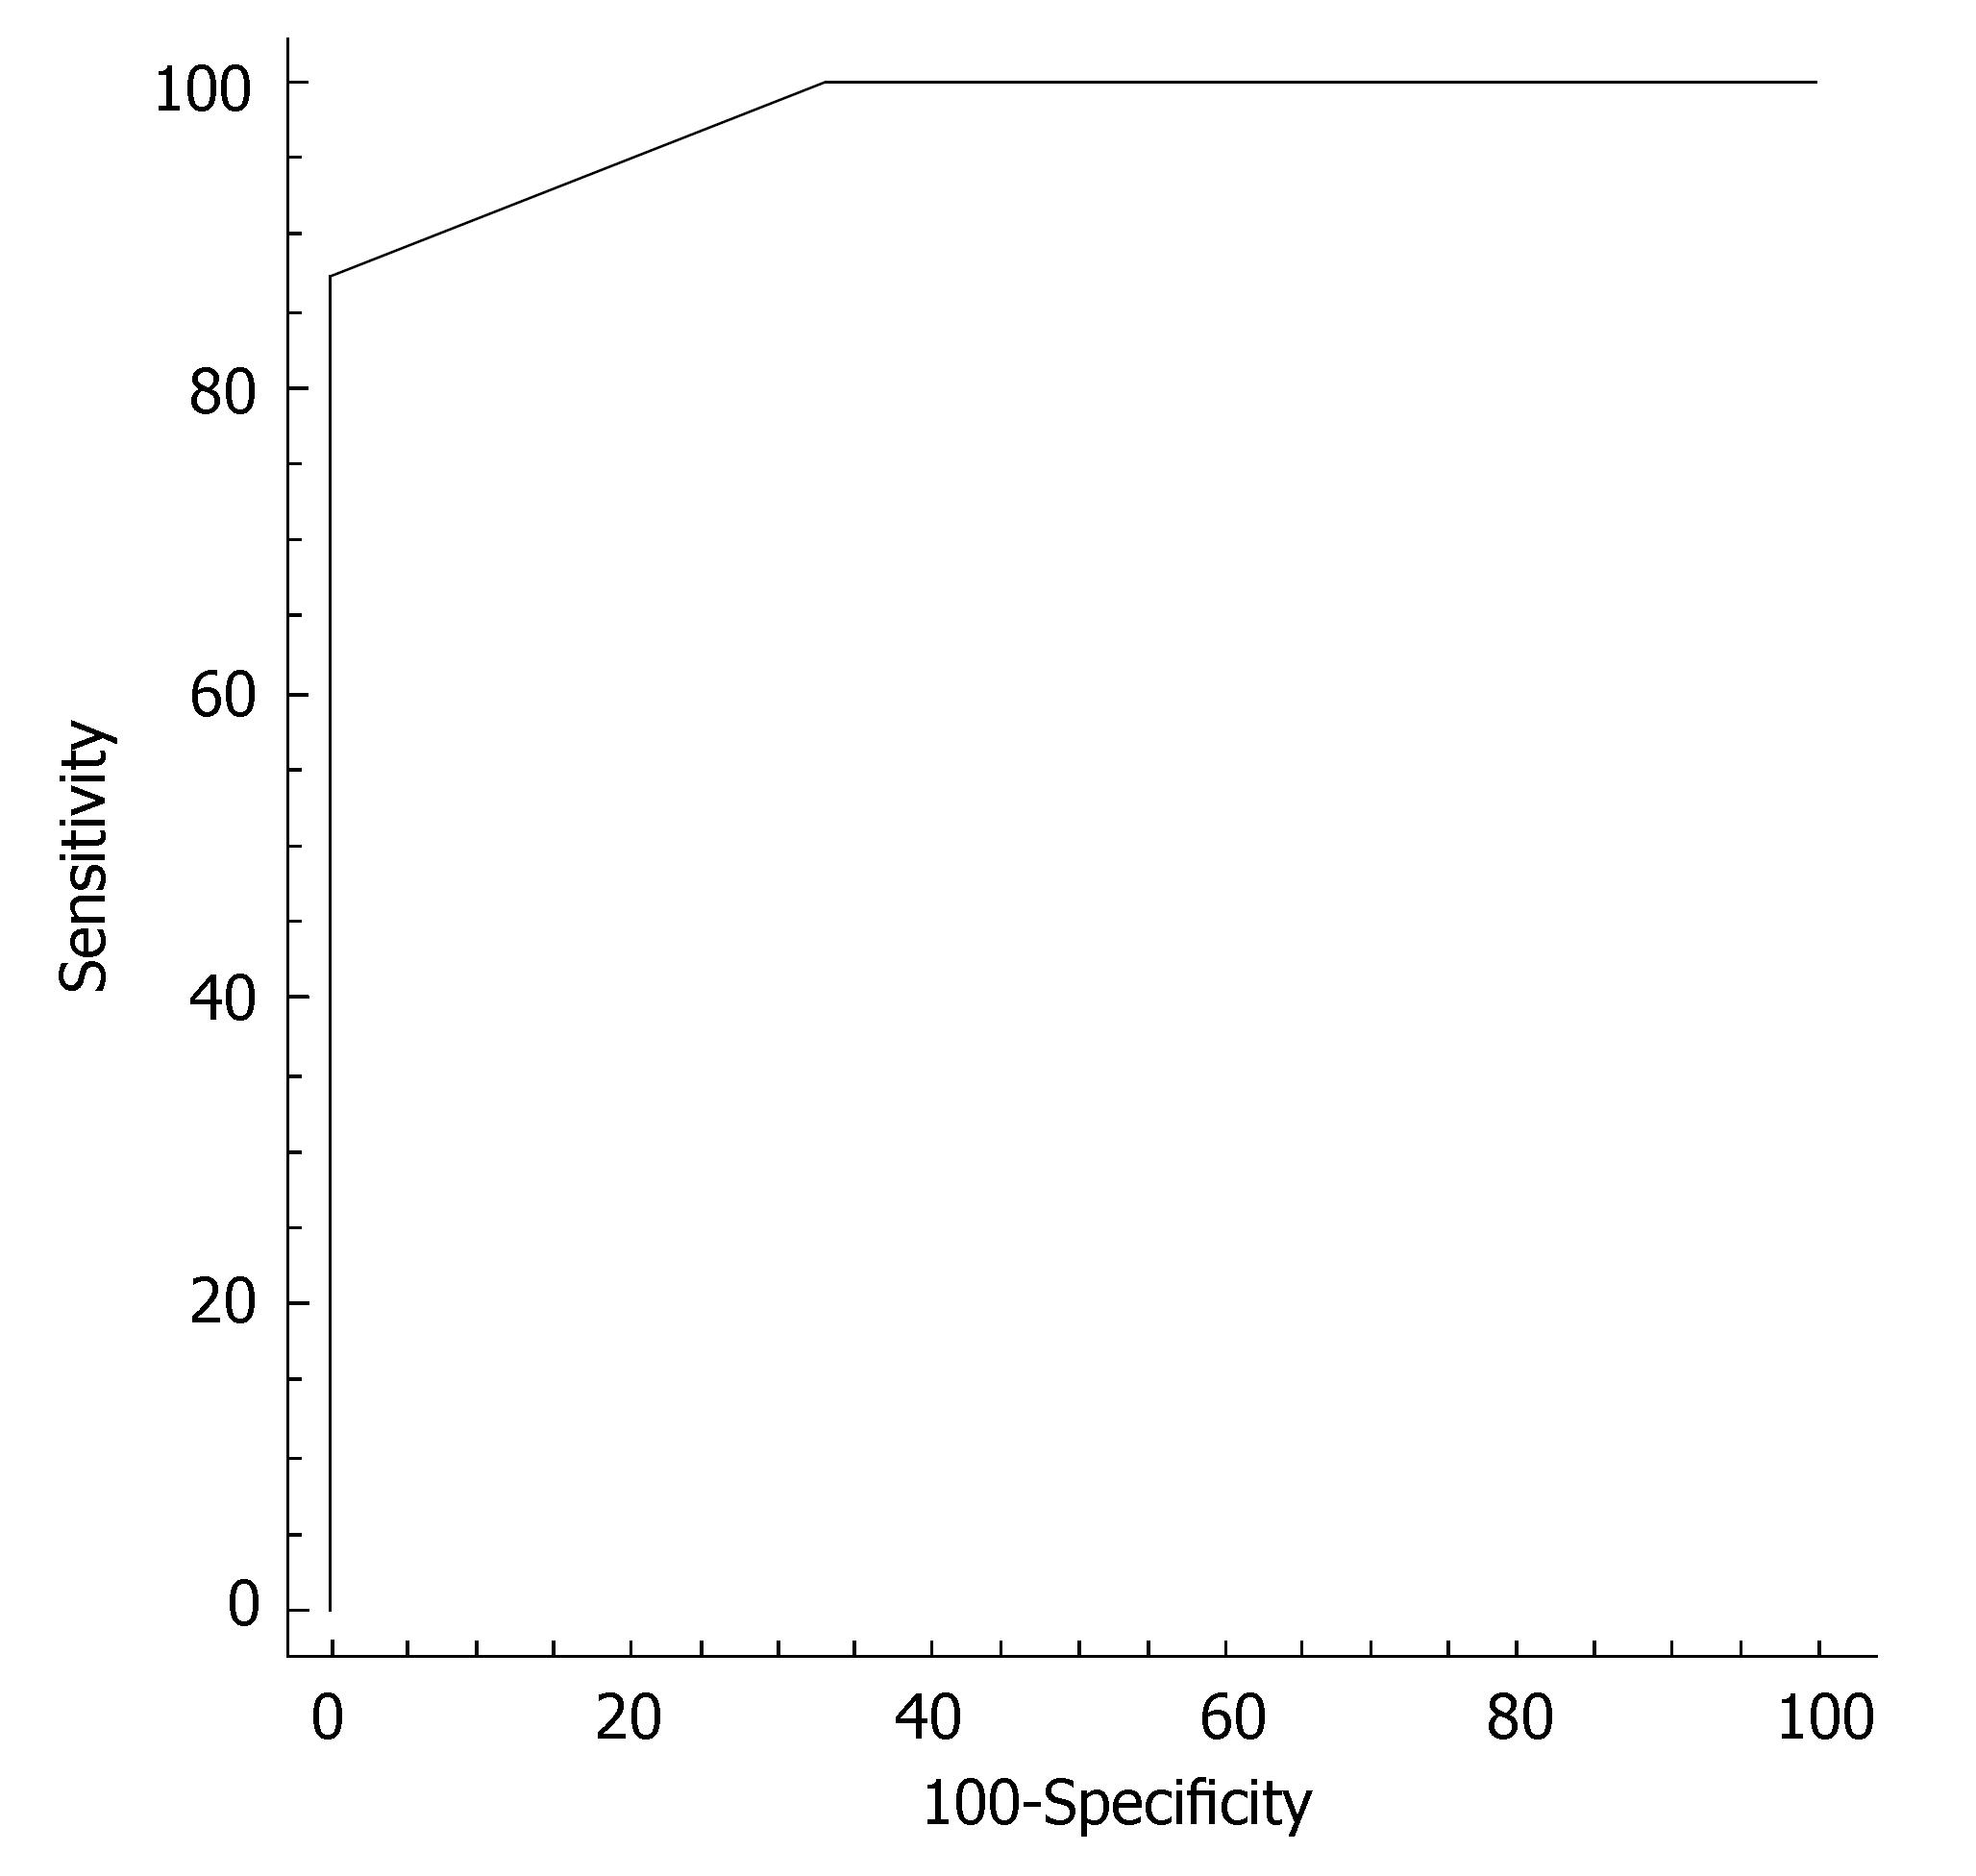
Figure 4 ROC curve of serum ALT for discriminating female HCV patients from women without liver disease.
The better cutoff value for ALT was at 22 IU/L, with sensitivity of 87.5% and specificity of 100% in identifying subjects without HCV infection.
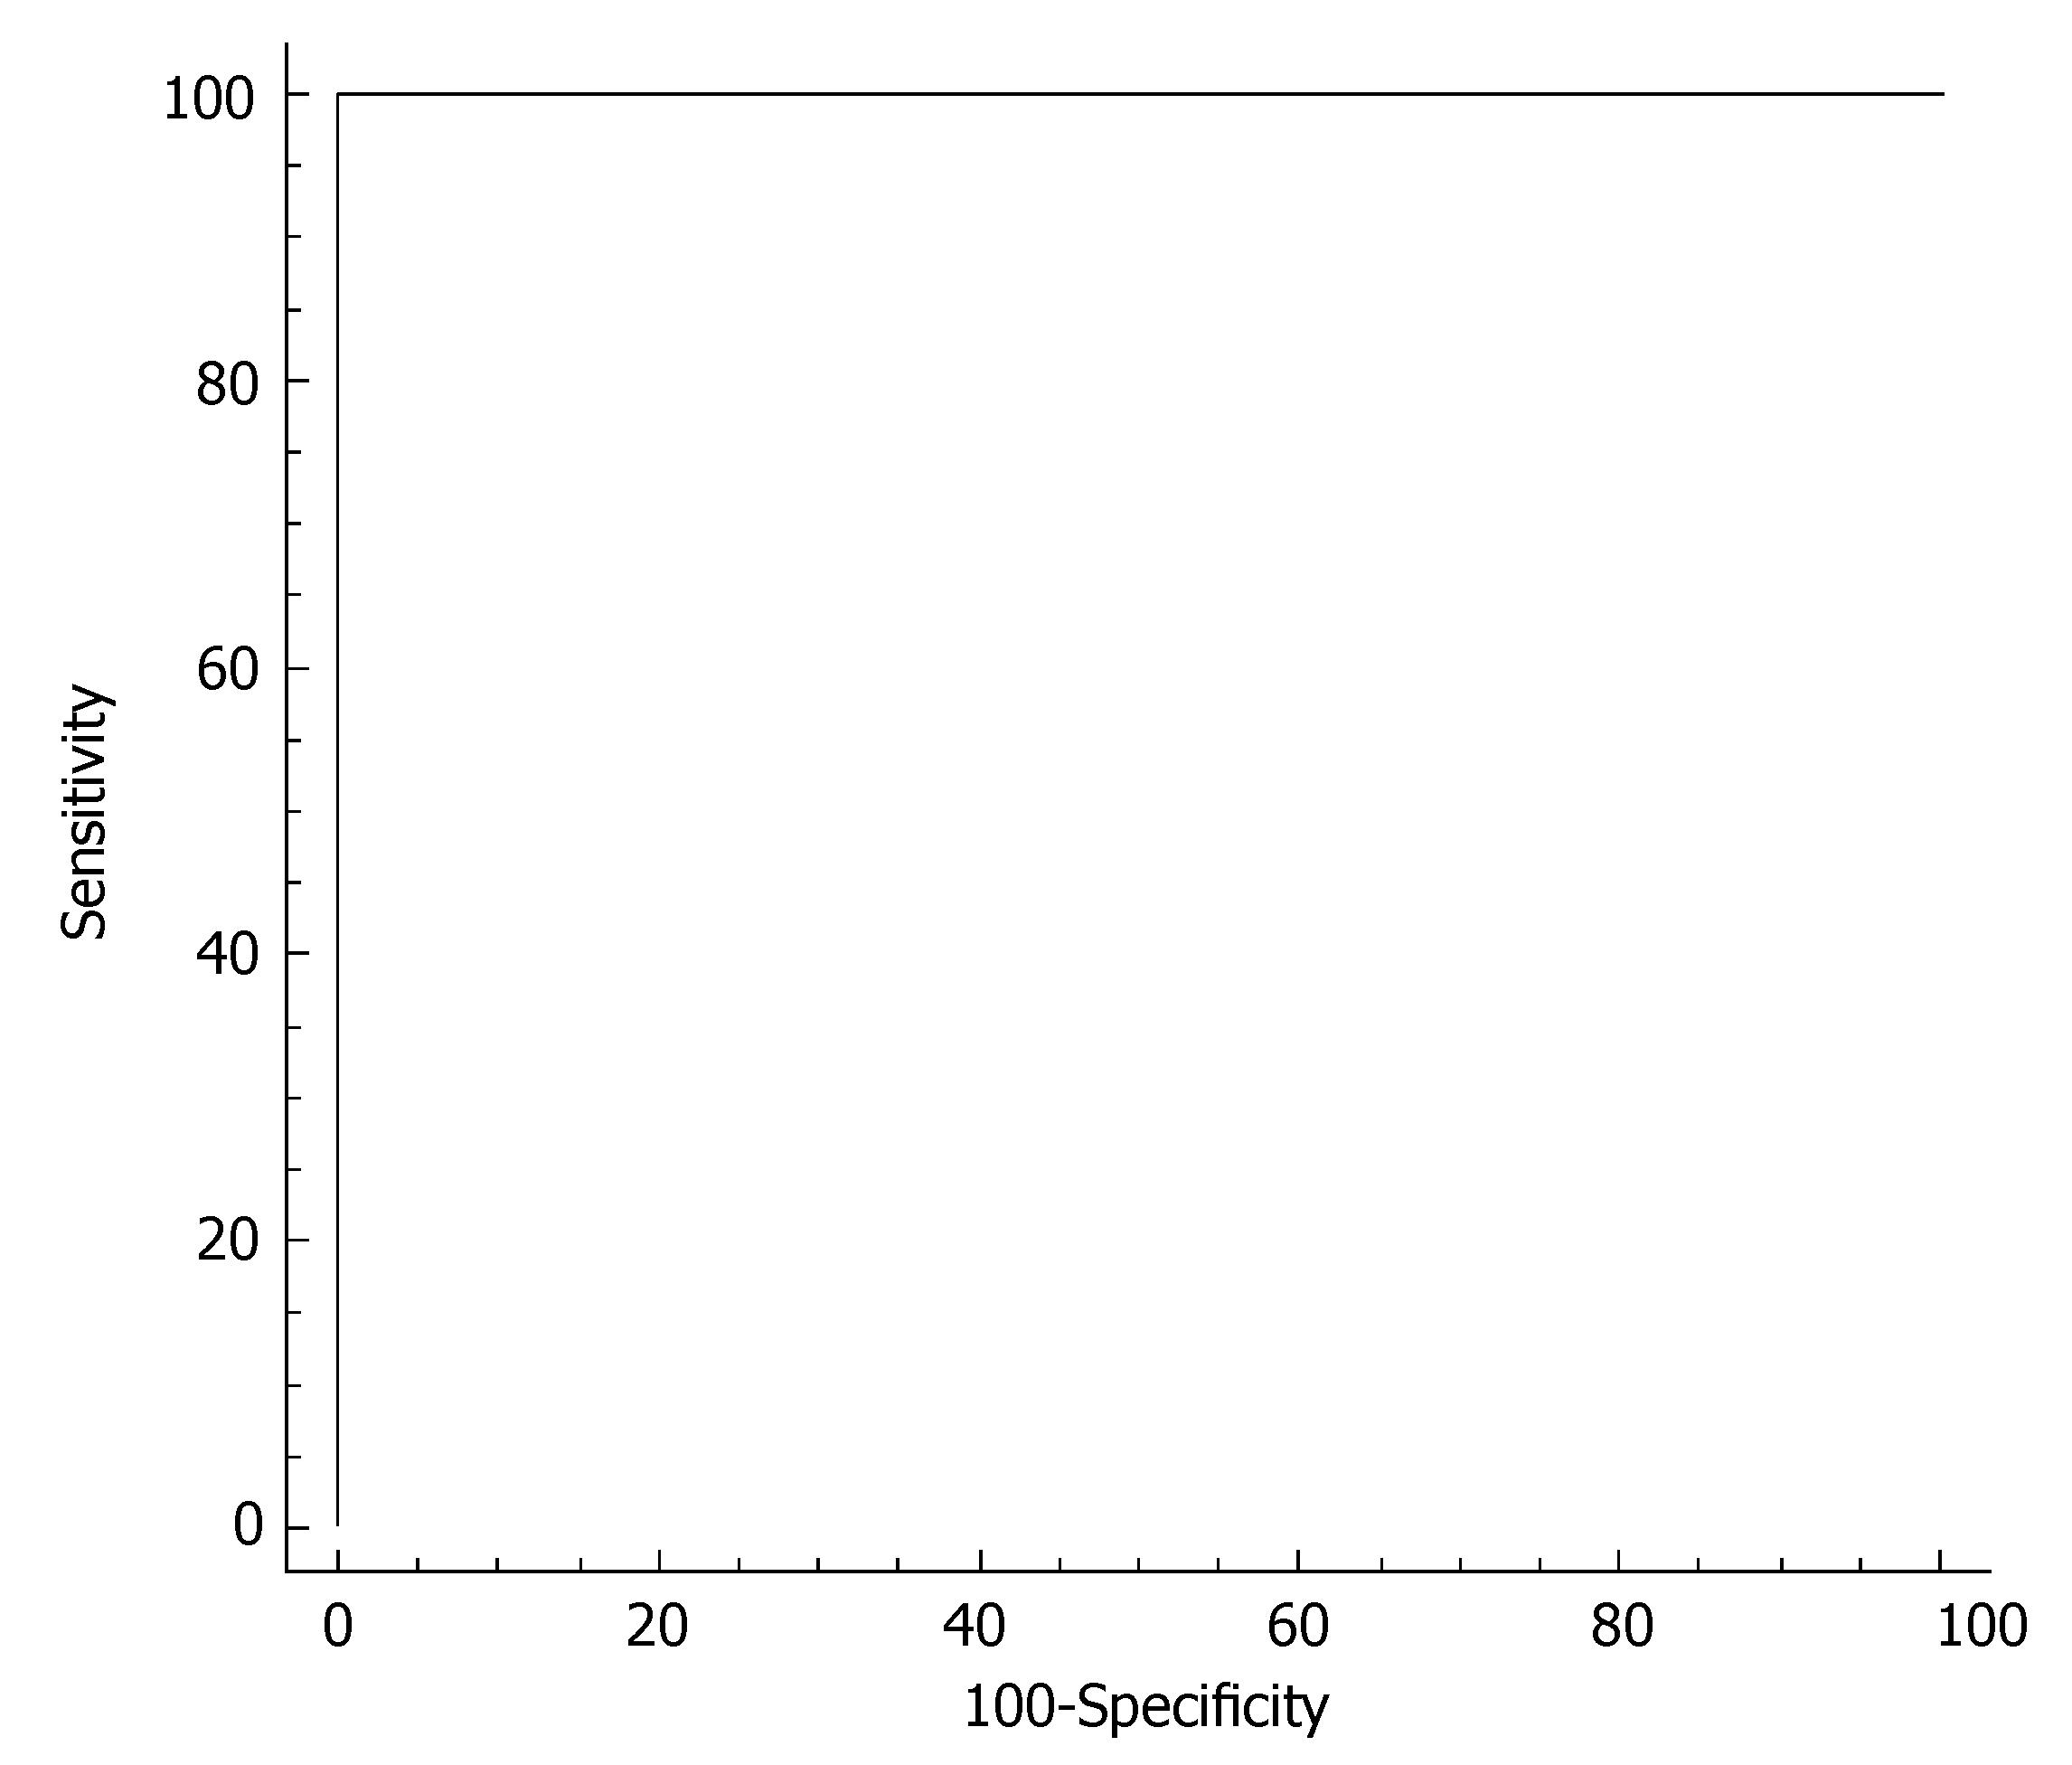
Figure 5 ROC curve of serum ALT for discriminating male HCV patients from men without liver disease.
The better cutoff value for ALT was at 23 IU/L, with sensitivity of 100% and specificity of 100% in identifying subjects without HCV infection.
- Citation: Akkaya O, Kiyici M, Yilmaz Y, Ulukaya E, Yerci O. Clinical significance of activity of ALT enzyme in patients with hepatitis C virus. World J Gastroenterol 2007; 13(41): 5481-5485
- URL: https://www.wjgnet.com/1007-9327/full/v13/i41/5481.htm
- DOI: https://dx.doi.org/10.3748/wjg.v13.i41.5481


