Copyright
©2007 Baishideng Publishing Group Co.
World J Gastroenterol. Jan 28, 2007; 13(4): 557-563
Published online Jan 28, 2007. doi: 10.3748/wjg.v13.i4.557
Published online Jan 28, 2007. doi: 10.3748/wjg.v13.i4.557
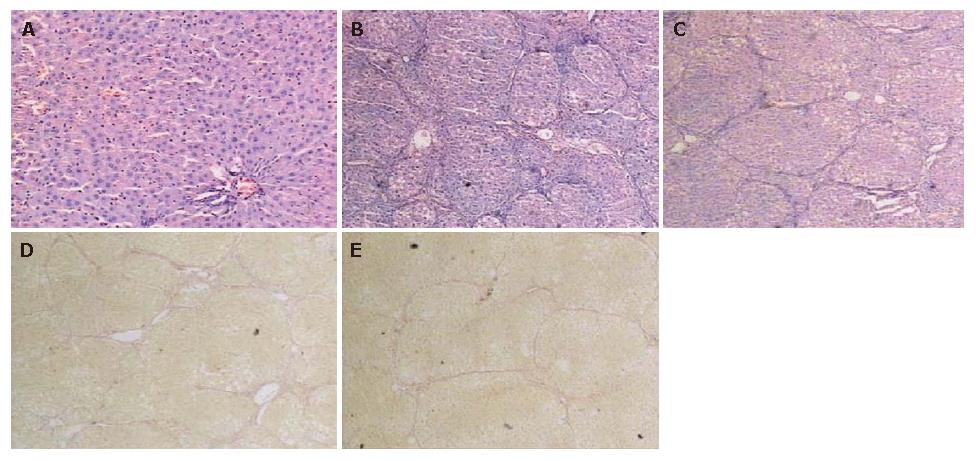
Figure 1 Light microscopy showing normal liver tissue in control group (A) (HE × 100), degenerated and necrotic liver cells associated with inflammatory cells in model group (B) (HE × 40), attenuated necrosis and infiltration of inflammatory cells after SSd treatment (C) (HE × 40), collagen fibers deposited in spaces of Disse and formation of pseudoloculi in model group (D) (Van Gieson × 40), and liver fibrosis tissue in SSd group (E).
The pathological change of liver was much milder in SSd group than in model group (Van Gieson × 40).
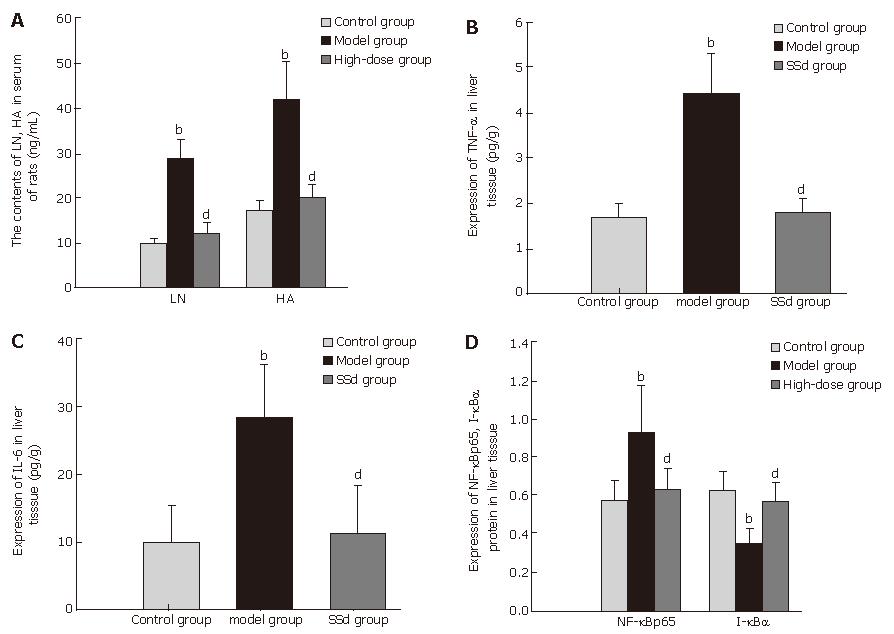
Figure 2 Analysis of serum LN and HA levels (A), expressions of TNF-α (B), IL-6 (C), and NF-κBp65 and I-κBα (D) in liver tissue after treatment with SSd.
bP < 0.01 vs control group; dP < 0.01 vs model group.
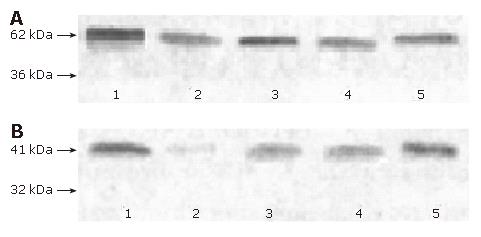
Figure 3 Images of Western blotting of NF-κBp65 (A) and I-κBα (B) in liver tissue of rats.
Lane 1: NF-κBp65 and I-κBα protein in control group; lane 2: NF-κBp65 and I-κBα in model group; lanes 3-5: NF-κBp65 and I-κBα in SSd group (from low to high-dose group).
- Citation: Dang SS, Wang BF, Cheng YA, Song P, Liu ZG, Li ZF. Inhibitory effects of saikosaponin-d on CCl4-induced hepatic fibrogenesis in rats. World J Gastroenterol 2007; 13(4): 557-563
- URL: https://www.wjgnet.com/1007-9327/full/v13/i4/557.htm
- DOI: https://dx.doi.org/10.3748/wjg.v13.i4.557


