Copyright
©2007 Baishideng Publishing Group Co.
World J Gastroenterol. Jan 28, 2007; 13(4): 548-556
Published online Jan 28, 2007. doi: 10.3748/wjg.v13.i4.548
Published online Jan 28, 2007. doi: 10.3748/wjg.v13.i4.548
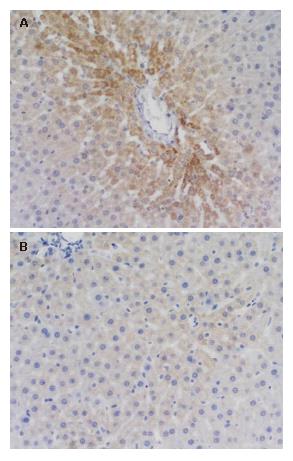
Figure 1 NF-κB expressions in the liver in the model group-3 h, (++) × 200 (A) and the treatment group-3 h, (-) ×200 (B).
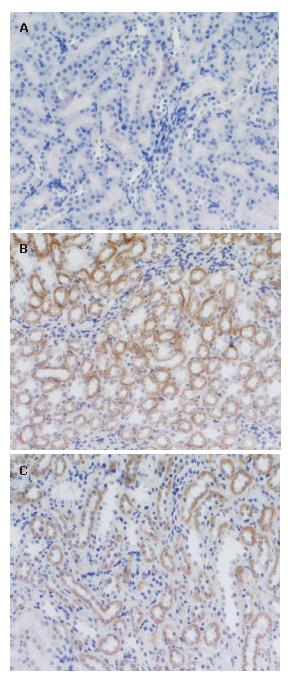
Figure 2 NF-κB expressions in the kidney in the sham operation group-12 h, (-) ×200 (A), model group-6 h, (++) × 200 (B) and model group-12 h, (++) × 200 (C).
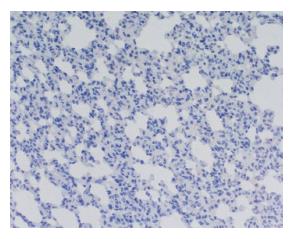
Figure 3 NF-κB expressions in the lung in the sham operation group-3 h, (-) ×200.
- Citation: Zhang XP, Zhang L, Chen LJ, Cheng QH, Wang JM, Cai W, Shen HP, Cai J. Influence of dexamethasone on inflammatory mediators and NF-κB expression in multiple organs of rats with severe acute pancreatitis. World J Gastroenterol 2007; 13(4): 548-556
- URL: https://www.wjgnet.com/1007-9327/full/v13/i4/548.htm
- DOI: https://dx.doi.org/10.3748/wjg.v13.i4.548


