Copyright
©2007 Baishideng Publishing Group Inc.
World J Gastroenterol. Oct 21, 2007; 13(39): 5180-5187
Published online Oct 21, 2007. doi: 10.3748/wjg.v13.i39.5180
Published online Oct 21, 2007. doi: 10.3748/wjg.v13.i39.5180
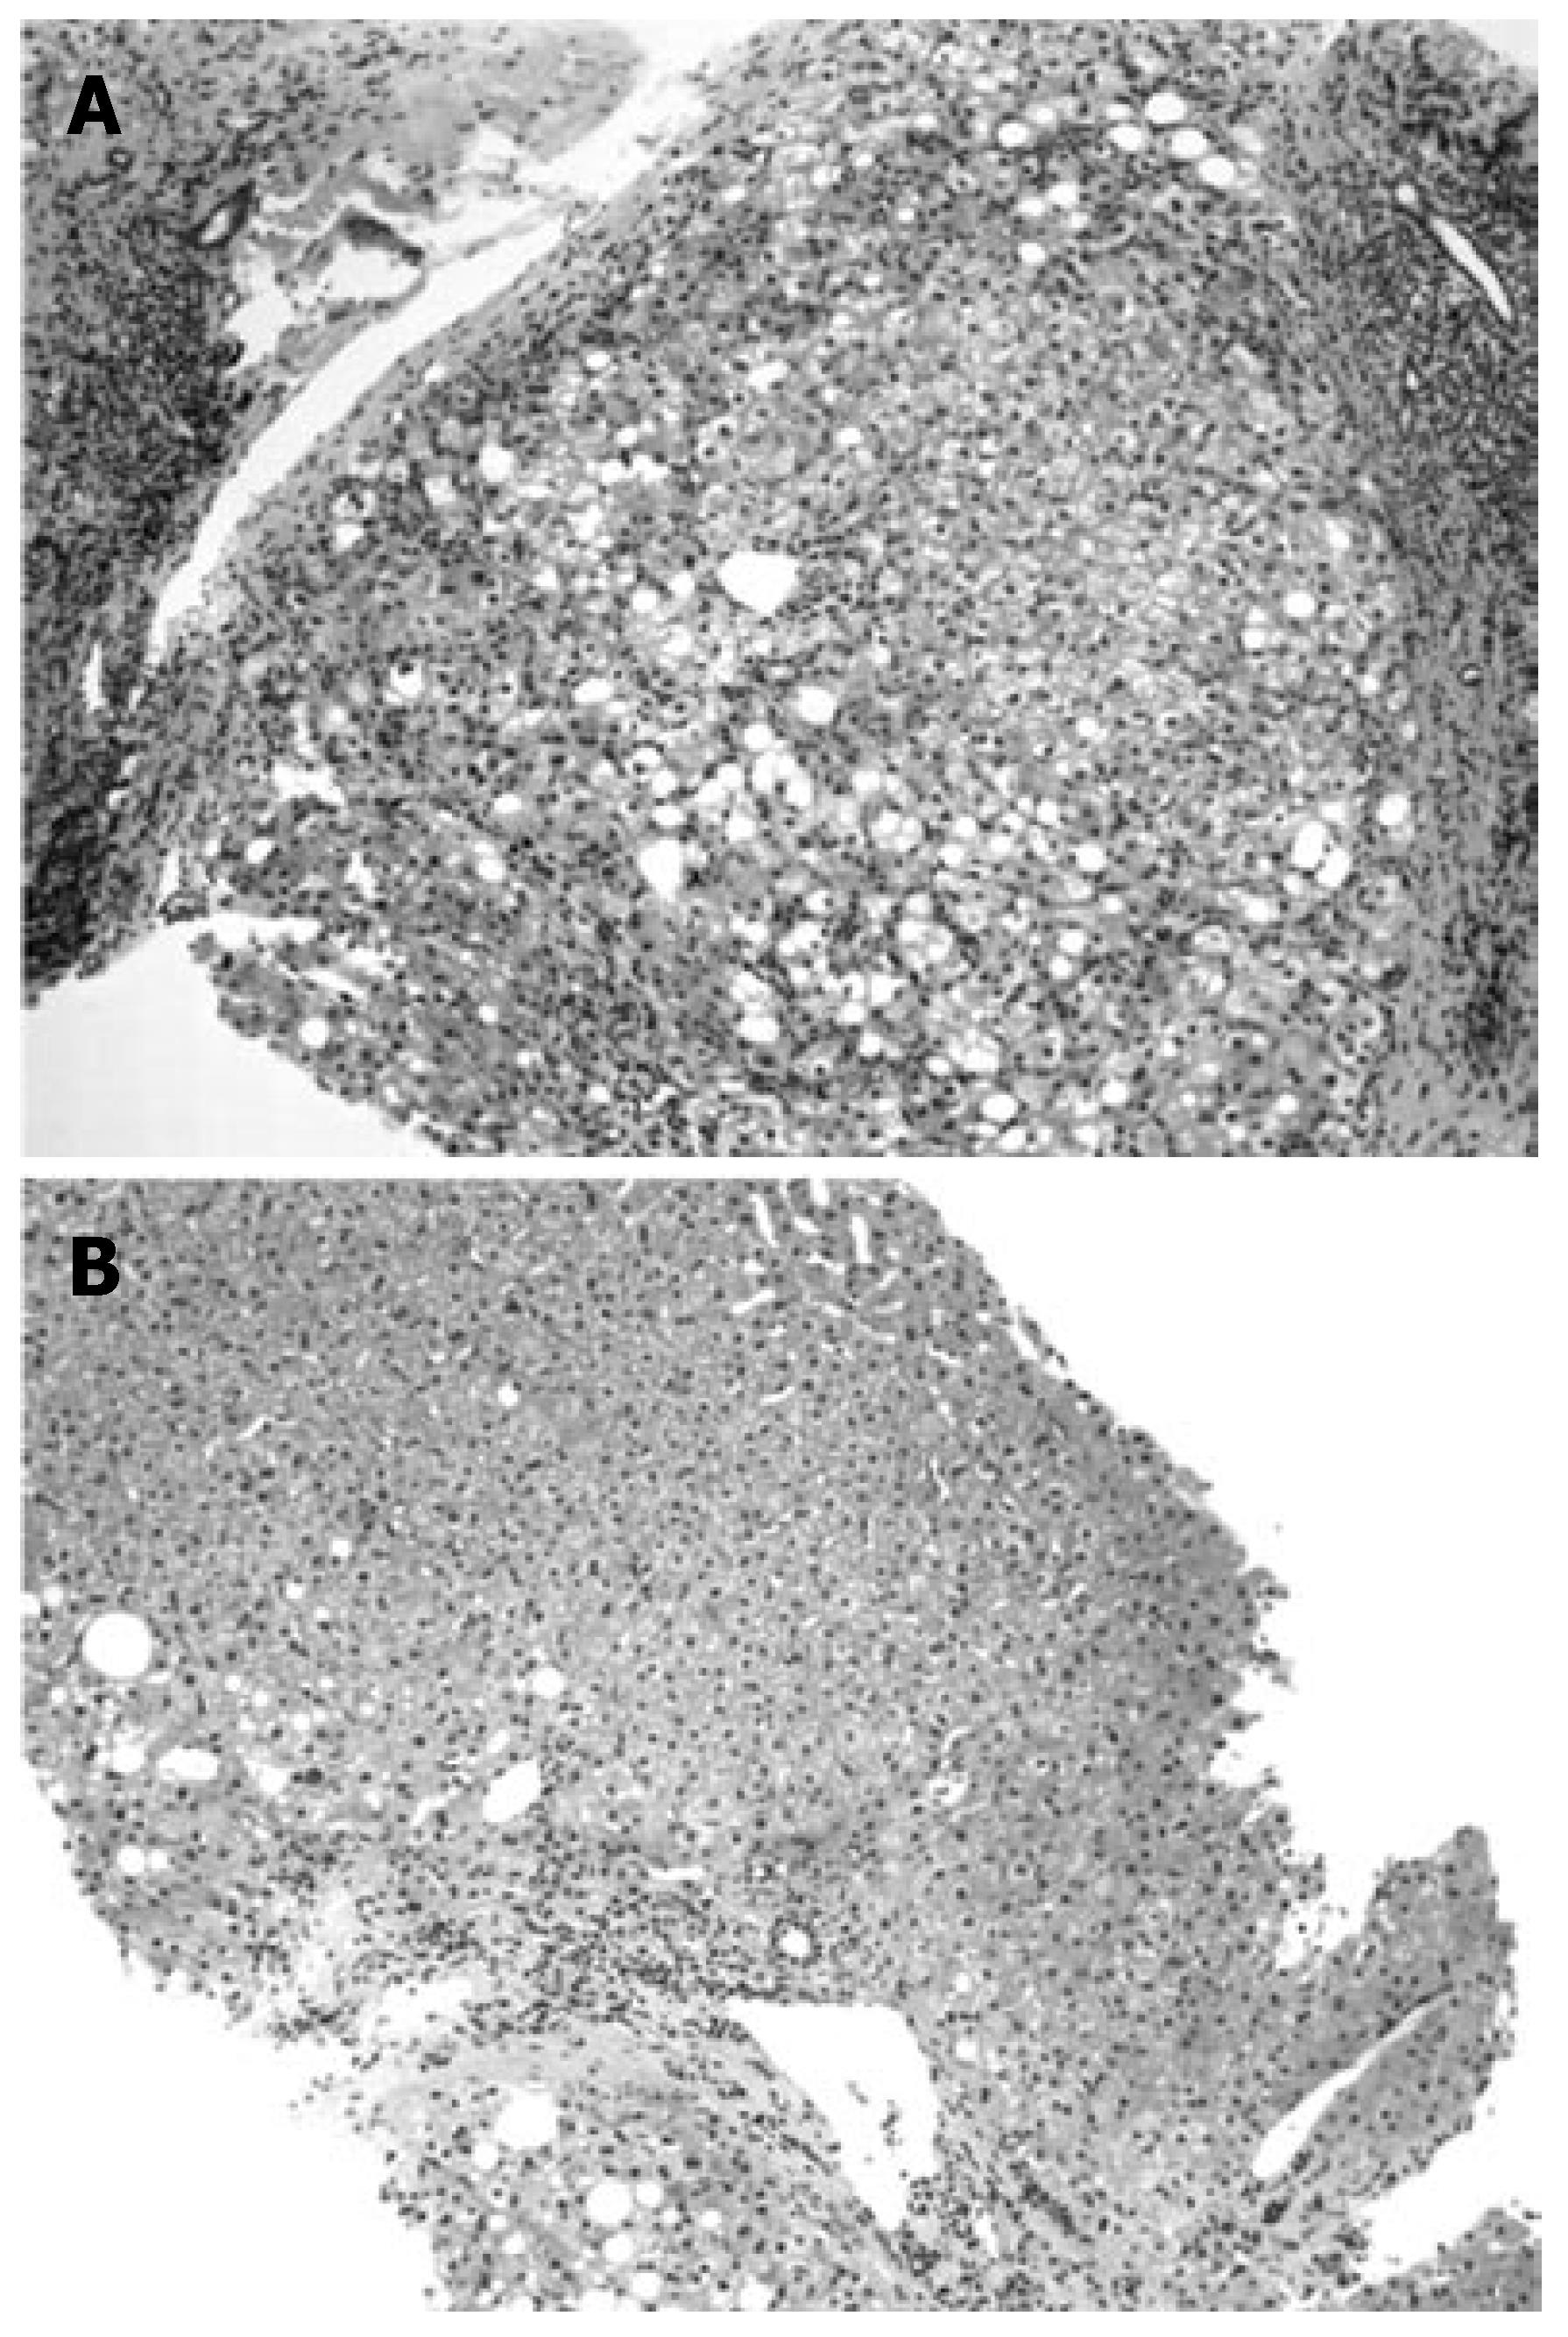
Figure 1 Liver histology of case 1 (HE staining).
A: Pre-IFN treatment liver histology showing F3 fibrosis grade 2 steatosis; B: Liver histology at the occurrence of HCC showing F2 fibrosis and grade 1 steatosis.
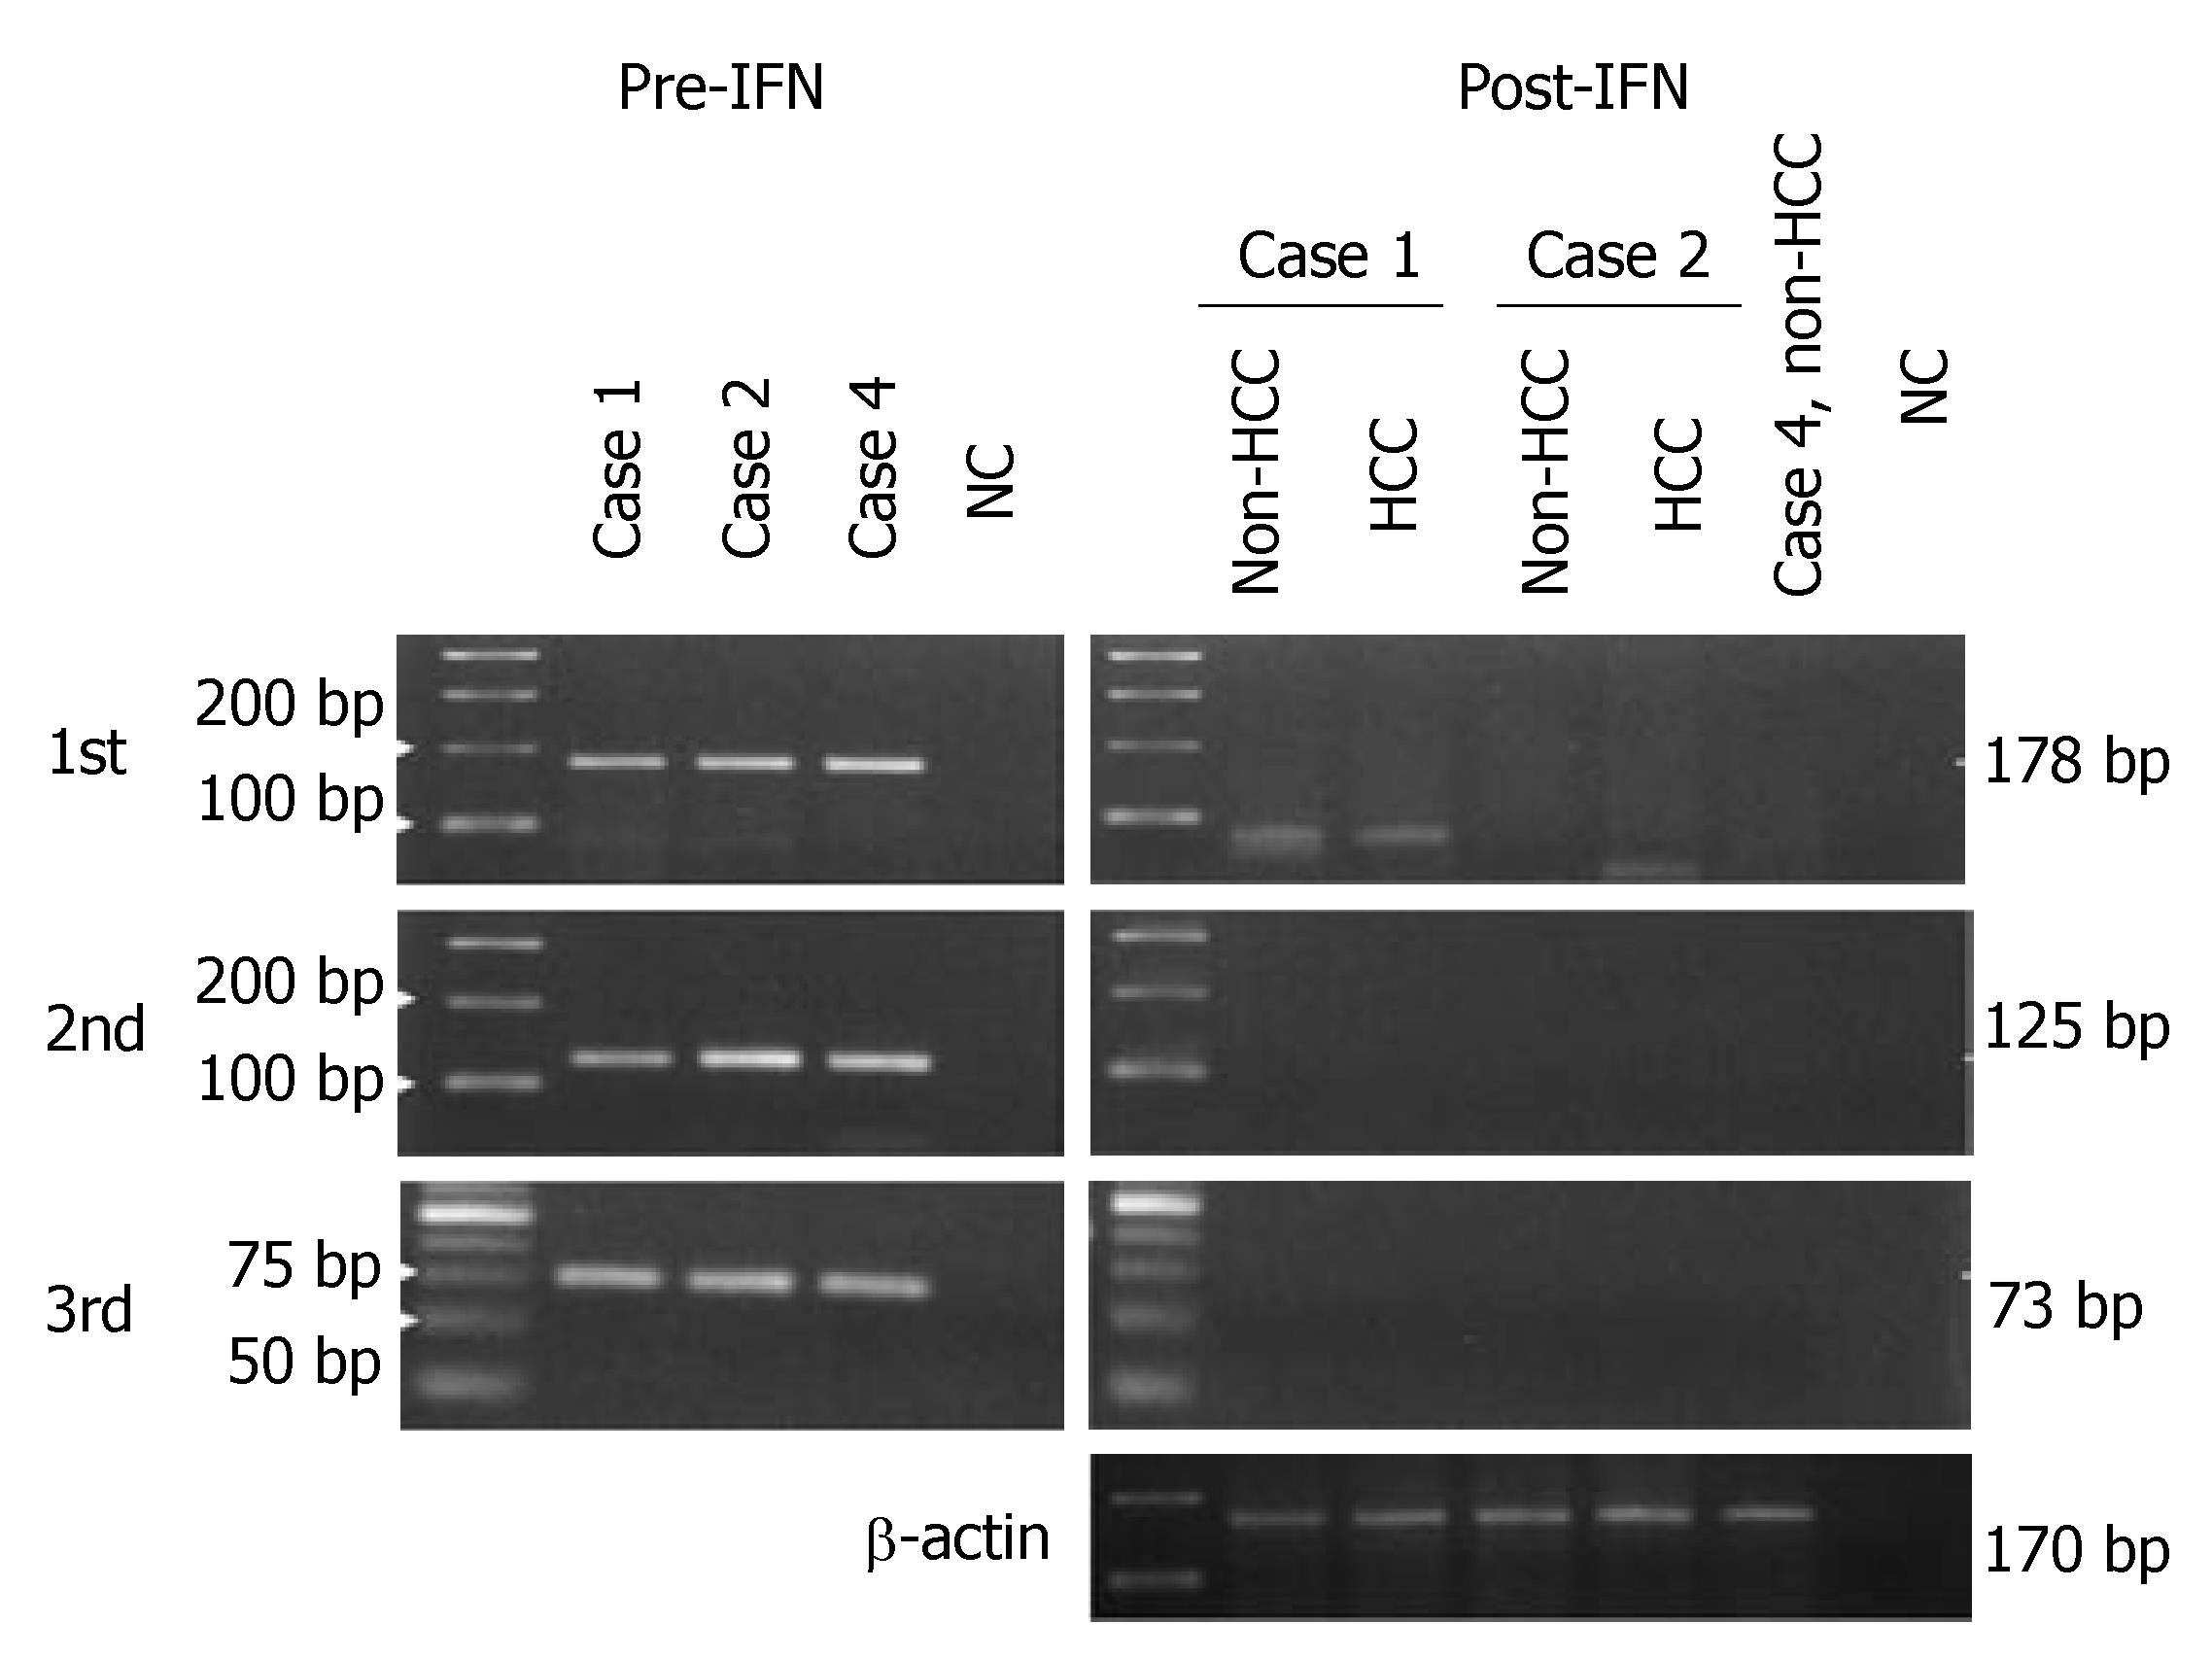
Figure 2 Amplification of HCV-RNA in liver tissues in cases 1, 2 and 4.
HCV was detected in all liver tissues at the pre-IFN therapy. NC: Without template cDNA, gave no distinct band. By contrast, HCV was demonstrated in neither HCC nor non-HCC tissue in cases 1 and 2 even after 3 cycles of RT-PCR. In case 4, in whom liver tissue was obtained after IFN therapy with percutaneous biopsy, HCV was not found either. β-actin was well amplified in these post-IFN specimens, demonstrating that total RNA had not been degraded. NC: Negative control.
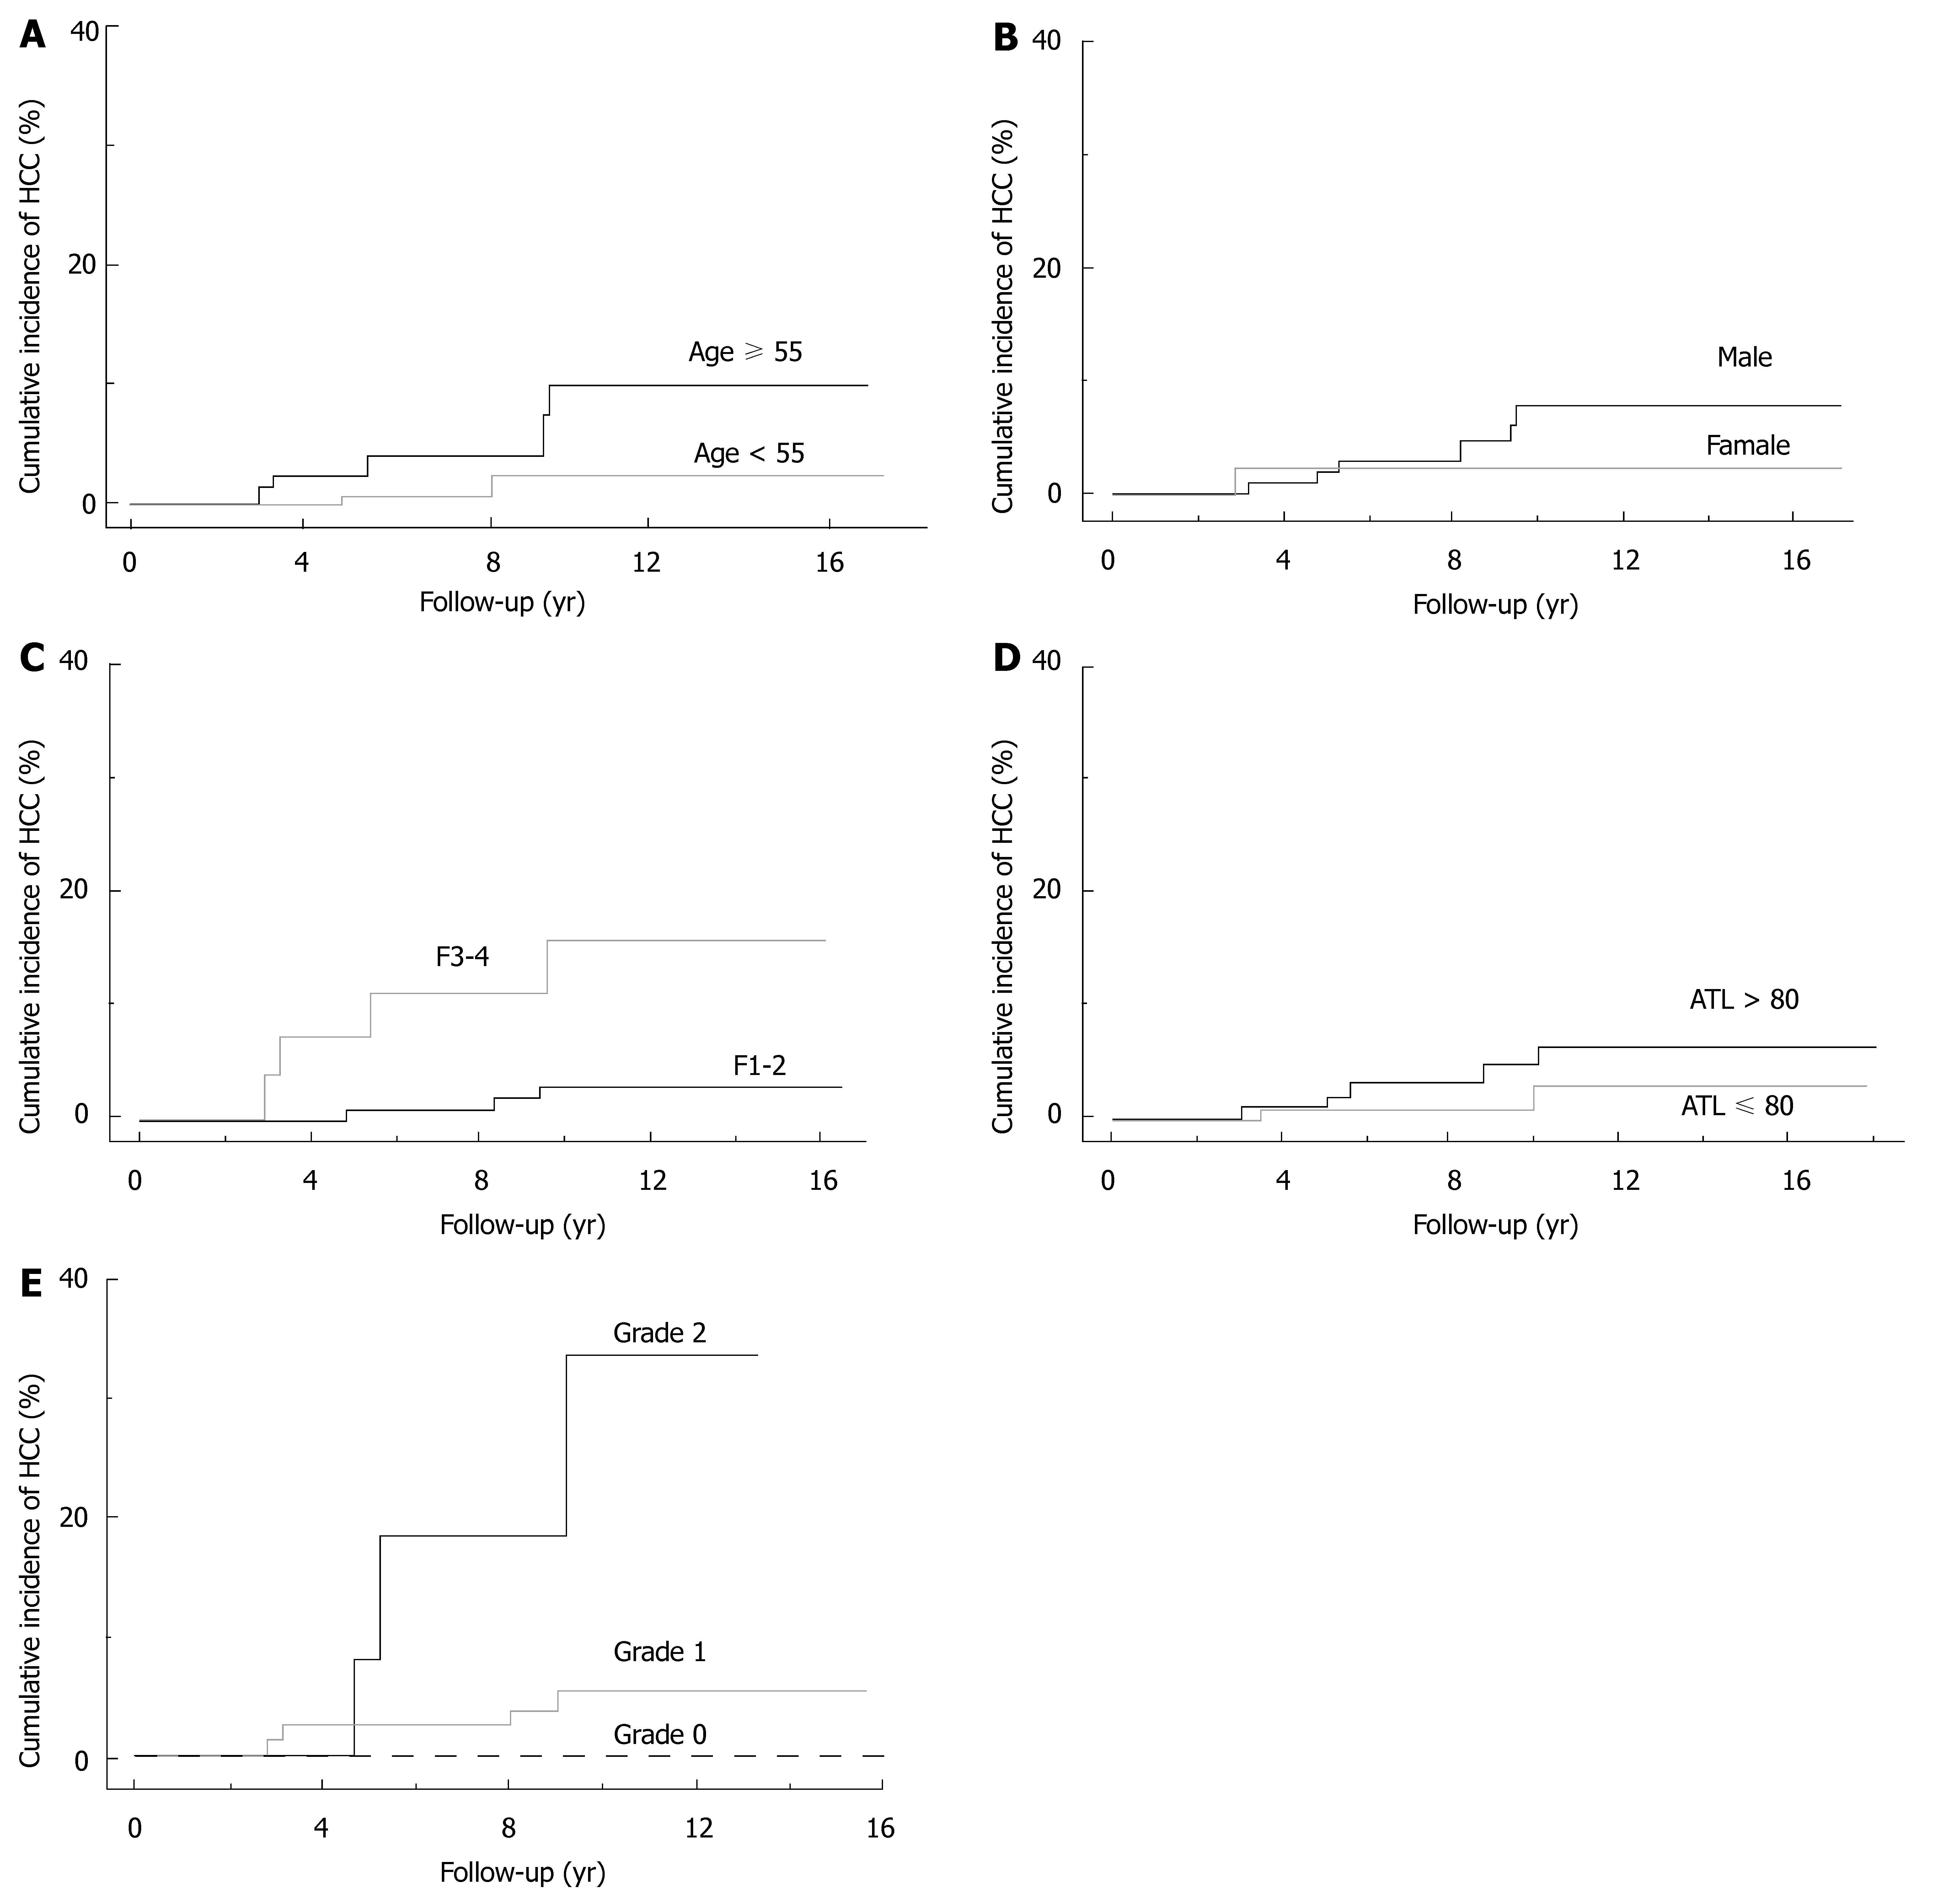
Figure 3 Cumulative incidence of HCC in SVR patients using the log-rank test.
A: Patients with age ≥ 55 (black line) and < 55 (gray line) years (P = 0.021); B: Male (black line) and female (gray line) patients (P = 0.389); C: patients with grading of fibrosis, F3-4 (black line) and F1-2 (gray line) (P = 0.0028); D: Patients with pre-treatment ALT levels, ALT > 80 IU (black line) and ≤ 80 IU (gray line) (P = 0.251); E: Patients with the grading of hepatic steatosis, grade 2 (black line), grade 1 (gray line), and grade 0 (gray dotted line) (P = 0.0002 between grade 2 and grade 1 or grade 0).
- Citation: Tanaka A, Uegaki S, Kurihara H, Aida K, Mikami M, Nagashima I, Shiga J, Takikawa H. Hepatic steatosis as a possible risk factor for the development of hepatocellular carcinoma after eradication of hepatitis C virus with antiviral therapy in patients with chronic hepatitis C. World J Gastroenterol 2007; 13(39): 5180-5187
- URL: https://www.wjgnet.com/1007-9327/full/v13/i39/5180.htm
- DOI: https://dx.doi.org/10.3748/wjg.v13.i39.5180


