Copyright
©2007 Baishideng Publishing Group Co.
World J Gastroenterol. Oct 7, 2007; 13(37): 5003-5008
Published online Oct 7, 2007. doi: 10.3748/wjg.v13.i37.5003
Published online Oct 7, 2007. doi: 10.3748/wjg.v13.i37.5003
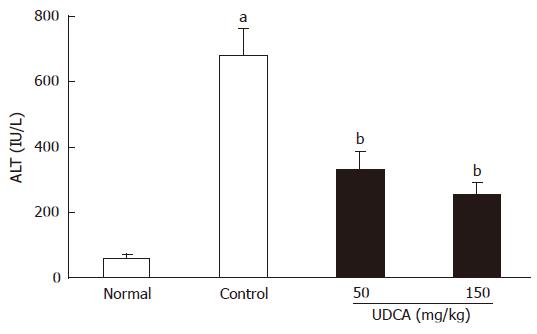
Figure 1 Effect of UDCA on serum ALT in hamsters fed CDCA.
Data are expressed as mean ± SE (n = 9). aP < 0.01 vs normal group (Student’s t-test); bP < 0.01 vs control group (Dunnett’s multiple comparison test).
Figure 2 Effect of UDCA on light micrographic changes of the liver in hamsters fed CDCA.
A: Normal; B: Control; C: 150 mg/kg UDCA (Hematoxylin-eosin staining). Bars indicate 100 μm.
- Citation: Iwaki T, Ishizaki K, Kinoshita S, Tanaka H, Fukunari A, Tsurufuji M, Imada T. Protective effects of ursodeoxycholic acid on chenodeoxycholic acid-induced liver injury in hamsters. World J Gastroenterol 2007; 13(37): 5003-5008
- URL: https://www.wjgnet.com/1007-9327/full/v13/i37/5003.htm
- DOI: https://dx.doi.org/10.3748/wjg.v13.i37.5003


