Copyright
©2007 Baishideng Publishing Group Co.
World J Gastroenterol. Sep 14, 2007; 13(34): 4641-4645
Published online Sep 14, 2007. doi: 10.3748/wjg.v13.i34.4641
Published online Sep 14, 2007. doi: 10.3748/wjg.v13.i34.4641
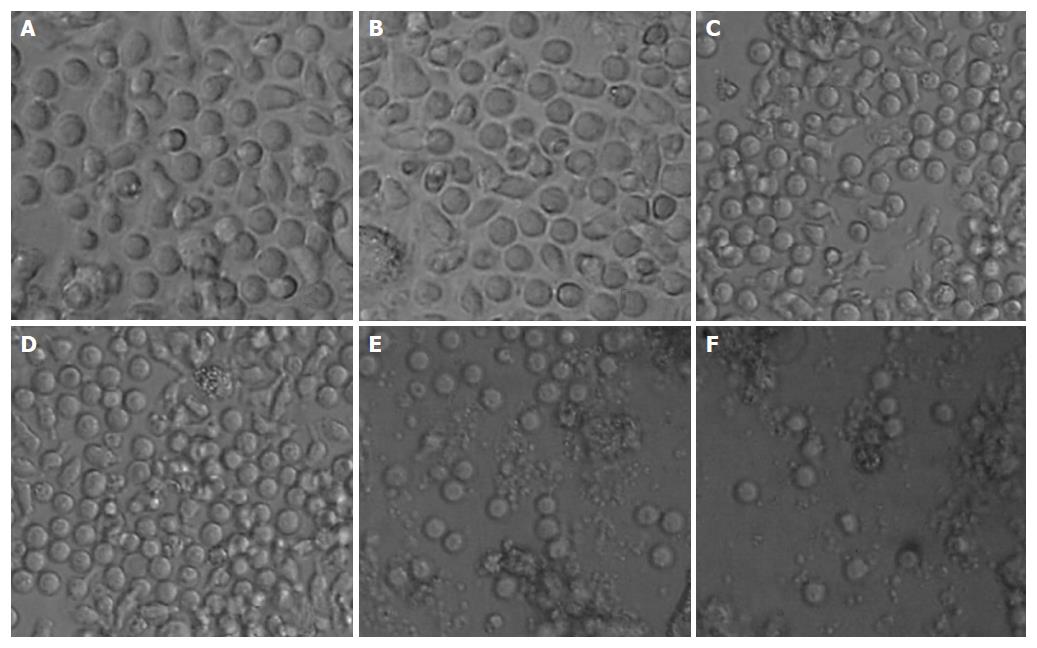
Figure 1 Morphology of DCs treated with lamivudine (LAM) at different concentrations on the 8th d (× 400).
A: Non-LAM-treated DC; B: DC + LAM (0.125 mmol/L); C: DC + LAM (0.25 mmol/L); D: DC + LAM (0.5 mmol/L); E: DC + LAM (1 mmol/L); F: DC + LAM (2 mmol/L).
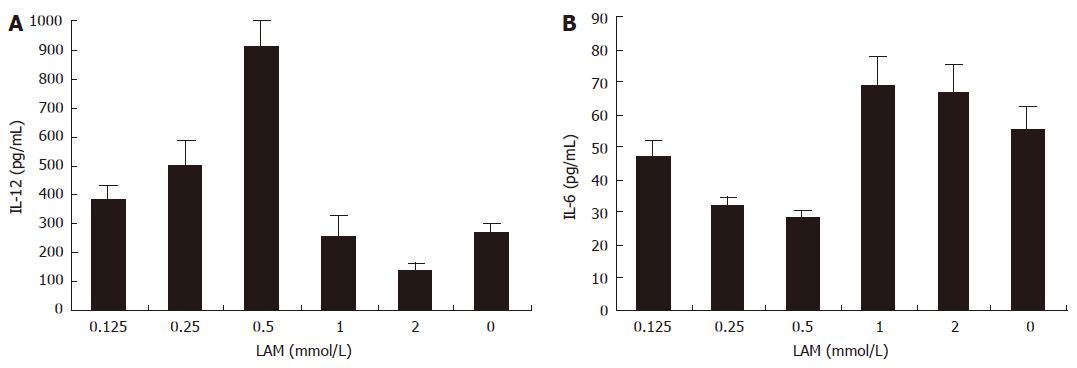
Figure 2 Modulation of cytokine secretion from DCs by LAM treatment.
Bars indicate the levels of IL-12 (A) and IL-6 (B) in culture media of DCs treated with LAM at different concentrations (mean ± SD, n = 15).
- Citation: Zheng PY, Zhang DY, Lu GF, Yang PC, Qi YM, Wang BS. Effects of lamivudine on the function of dendritic cells derived from patients with chronic hepatitis B virus infection. World J Gastroenterol 2007; 13(34): 4641-4645
- URL: https://www.wjgnet.com/1007-9327/full/v13/i34/4641.htm
- DOI: https://dx.doi.org/10.3748/wjg.v13.i34.4641


