Copyright
©2007 Baishideng Publishing Group Co.
World J Gastroenterol. Sep 14, 2007; 13(34): 4579-4585
Published online Sep 14, 2007. doi: 10.3748/wjg.v13.i34.4579
Published online Sep 14, 2007. doi: 10.3748/wjg.v13.i34.4579
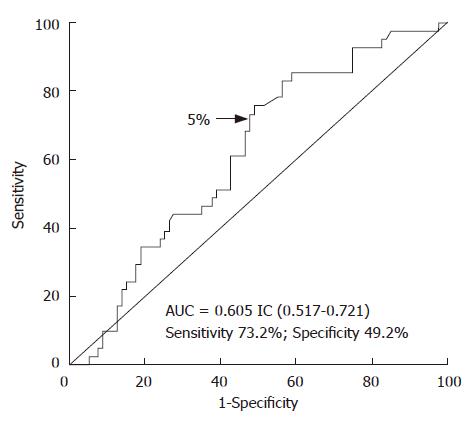
Figure 1 (ROC) curve for percentage of 13C-phenylalanine oxidation in predicting mortality (The optimal cut off point with the highest sensitivity and specificity for survival in 118 patients with chronic liver failure was 5.
0%).
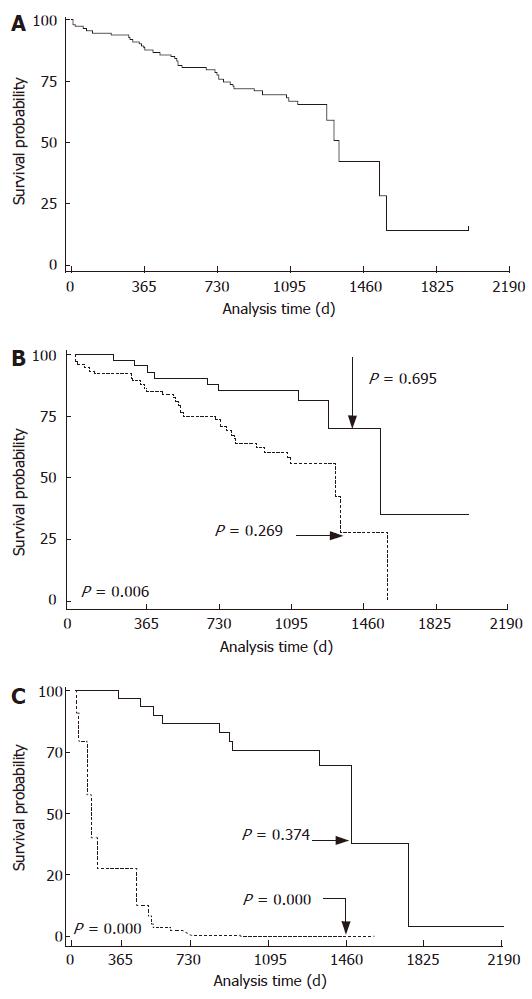
Figure 2 Kaplan-Meier statistics for survival probability.
A: All patients; B: Percentage of 13C-phenylanine oxidation; C: Percentage of 13C-phenylanine oxidation adjusted for covariables (age < 60 years and ≥ 60 years, albumin, total bilirubin and creatinine). P values are given by nonparametric log-rank test.
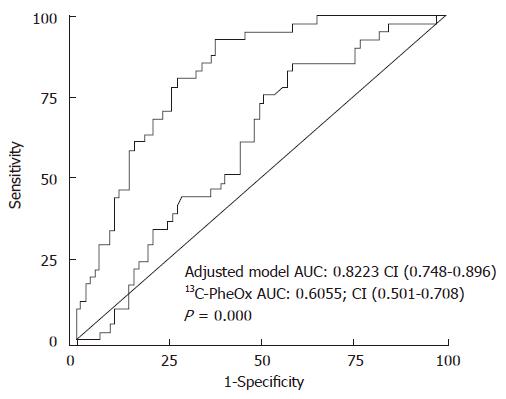
Figure 3 (ROC) curve for percentage of 13C-phenylalanine oxidation and percentage of 13C-phenylalanine oxidation adjusted for age (age < 60 years and ≥ 60 years), albumin, total bilirubin and creatinine in predicting mortality (n = 118).
- Citation: Gallardo-Wong I, Morán S, Rodríguez-Leal G, Castañeda-Romero B, Mera R, Poo J, Uribe M, Dehesa M. Prognostic value of 13C-phenylalanine breath test on predicting survival in patients with chronic liver failure. World J Gastroenterol 2007; 13(34): 4579-4585
- URL: https://www.wjgnet.com/1007-9327/full/v13/i34/4579.htm
- DOI: https://dx.doi.org/10.3748/wjg.v13.i34.4579


