Copyright
©2007 Baishideng Publishing Group Co.
World J Gastroenterol. Jan 21, 2007; 13(3): 383-390
Published online Jan 21, 2007. doi: 10.3748/wjg.v13.i3.383
Published online Jan 21, 2007. doi: 10.3748/wjg.v13.i3.383
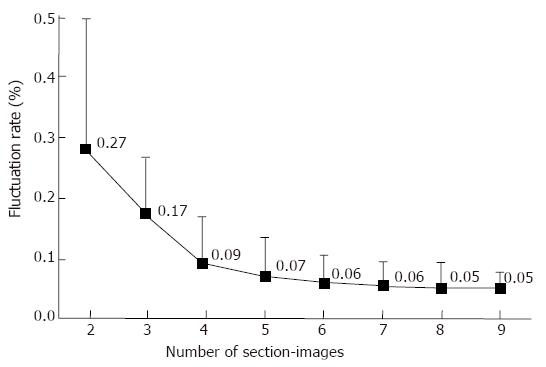
Figure 1 The number of section-images used to calculate the morphological fibrosis index (MFI) and the fluctuation rates of the MFI in the 12 randomly selected liver samples (mean ± SD).
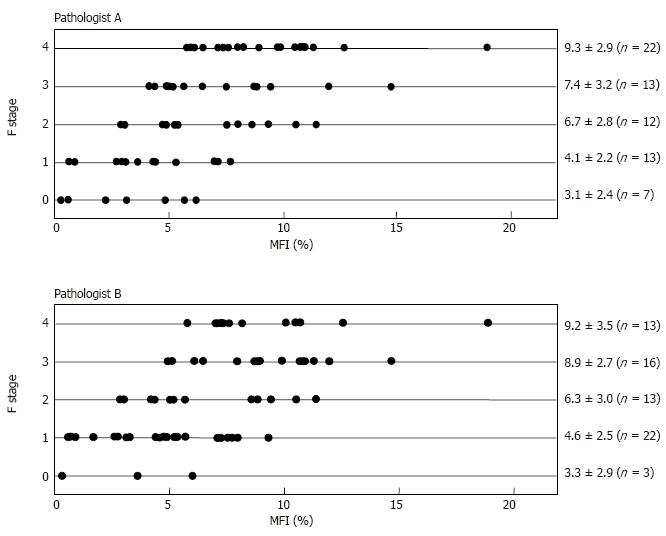
Figure 2 Relationship between the morphological fibrosis index (MFI) and the histological stage of liver fibrosis.
METAVIR scores were independently determined by two experienced pathologists.
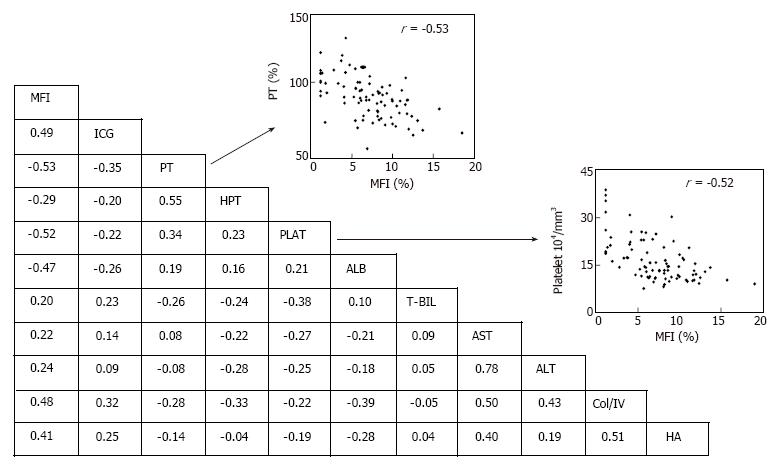
Figure 3 Correlation coefficient among parameters for the assessment of liver damage.
The left column represents the correlation coefficient between the morphological fibrosis index (MFI) values and clinical parameters of liver function tests. ICG: Indocyanine green dye retention test at 15 min; PT: Prothrombin time (as a % of normal); HPT: Hepaplastin test; PLAT: Platelet count; ALB: Albumin; T-Bil: Total bilirubin; AST: Aspartate aminotransferase; ALT: Alanine aminotransferase; Col/IV: Type IV collagen 7s; HA: Hyaluronic acid.
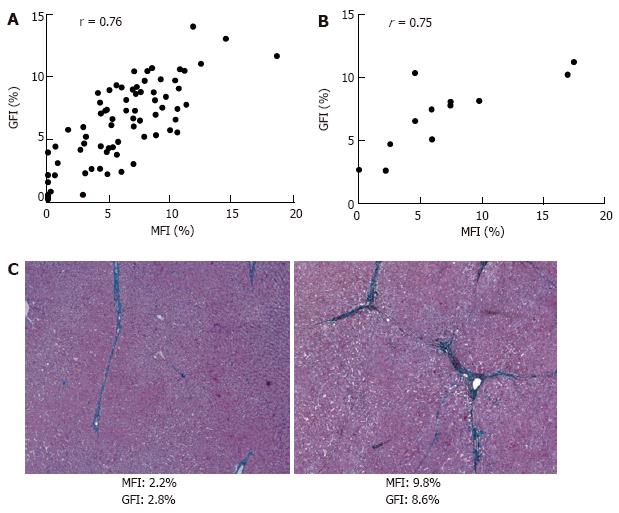
Figure 4 Correlation between the morphologic MFI values and the genetic GFI values in the 74 training samples (A) and the 12 test samples (B).
(C) Two representative sections after azan staining (× 40) and their corresponding MFI and the GFI values.
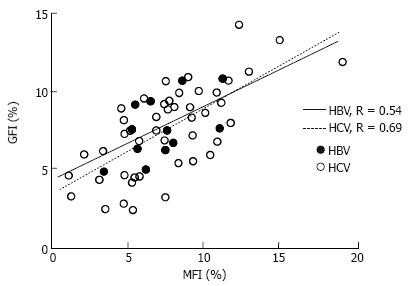
Figure 5 Correlation between the morphologic MFI values and the genetic GFI values in livers infected with hepatitis B virus (HBV) and hepatitis C virus (HCV).
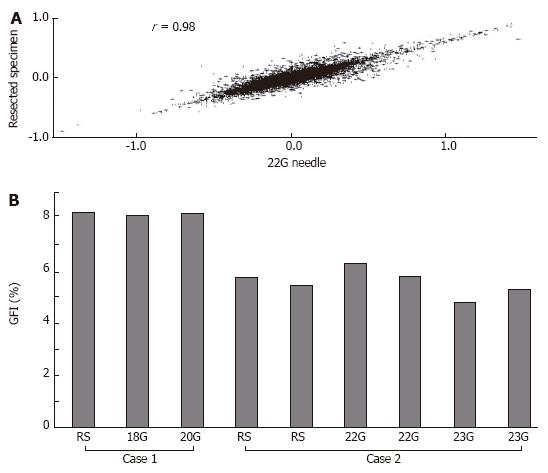
Figure 6 Gene-expression correlation between surgical resection and 22-guage needle liver biopsy specimens from the same patient.
Intensity data were plotted and the correlation coefficient calculated by the Rosetta Luminator system v2.0 (A). The GFI values of resected and biopsy specimens were determined using the same formula based on the 4 marker clones (B). RS: Resected specimen.
- Citation: Utsunomiya T, Okamoto M, Wakiyama S, Hashimoto M, Fukuzawa K, Ezaki T, Aishima S, Yoshikawa Y, Hanai T, Inoue H, Barnard GF, Mori M. A specific gene-expression signature quantifies the degree of hepatic fibrosis in patients with chronic liver disease. World J Gastroenterol 2007; 13(3): 383-390
- URL: https://www.wjgnet.com/1007-9327/full/v13/i3/383.htm
- DOI: https://dx.doi.org/10.3748/wjg.v13.i3.383


