Copyright
©2007 Baishideng Publishing Group Co.
World J Gastroenterol. Jan 21, 2007; 13(3): 349-354
Published online Jan 21, 2007. doi: 10.3748/wjg.v13.i3.349
Published online Jan 21, 2007. doi: 10.3748/wjg.v13.i3.349
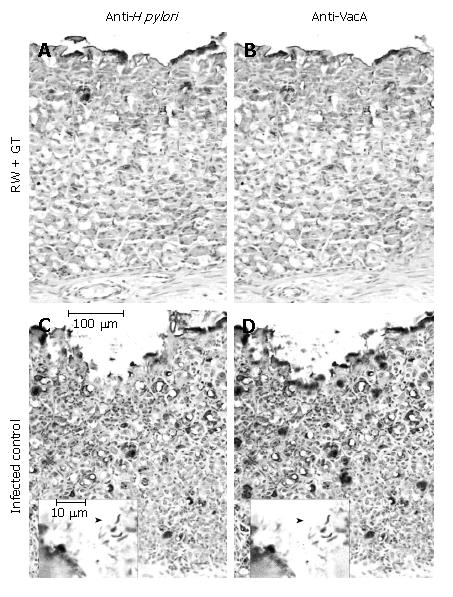
Figure 1 Representative images of IHC detection of H pylori (A and C) or VacA (B and D) in gastric mucosa sections from H pylori-infected mice in the presence (A and B) or in the absence (C and D) of RW + GT treatment.
In the gastric epithelium of infected controls (C and D, adjacent sections) H pylori and VacA are detectable with a similar pattern, both superficially and deeply, while upon RW + GT treatment (A and B, adjacent sections) the immunostaining is mainly confined to the surface of the epithelium. Inserts at larger magnification show typical H pylori morphology (arrowheads).
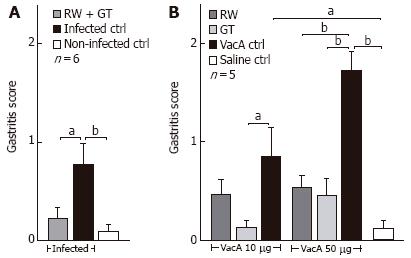
Figure 2 Gastritis score of H pylori-infected (A) or VacA-treated (B) mice in the presence or in the absence of RW and/or GT as indicated.
Mean of antrum, corpus and fundus scores of each group. Bars = SE. aP < 0.05, bP < 0.01 comparison between the indicated groups.
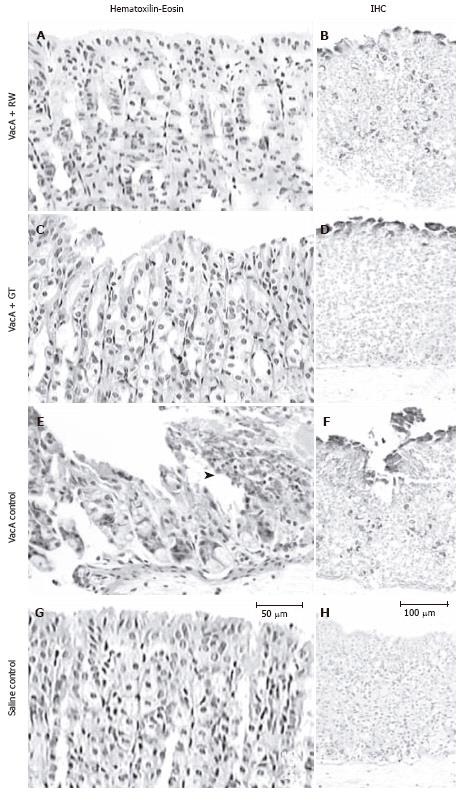
Figure 3 Representative images of sections of gastric corpus mucosa of mice treated with 50 μg of VacA in the presence (A-D) or in the absence (E and F) of RW or GT as indicated, in comparison with saline-treated control (G and H).
HE staining (A, C, E and G): VacA control (E) shows a typical loss of mucosal architecture, with areas of cellular debris and inflammatory cells admixture (arrowhead), almost undetectable in the presence of RW (A) or GT (C). IHC detection of VacA (B, D, F and H): distribution of VacA upon RW treatment (B) is both superficial and deep, similarly to that of VacA-treated control (F), while upon GT treatment (D) VacA is detectable only on the surface of gastric epithelium.
-
Citation: Ruggiero P, Rossi G, Tombola F, Pancotto L, Lauretti L, Del Giudice G, Zoratti M. Red wine and green tea reduce
H pylori- or VacA-induced gastritis in a mouse model. World J Gastroenterol 2007; 13(3): 349-354 - URL: https://www.wjgnet.com/1007-9327/full/v13/i3/349.htm
- DOI: https://dx.doi.org/10.3748/wjg.v13.i3.349


