Copyright
©2007 Baishideng Publishing Group Co.
World J Gastroenterol. Aug 7, 2007; 13(29): 3956-3961
Published online Aug 7, 2007. doi: 10.3748/wjg.v13.i29.3956
Published online Aug 7, 2007. doi: 10.3748/wjg.v13.i29.3956
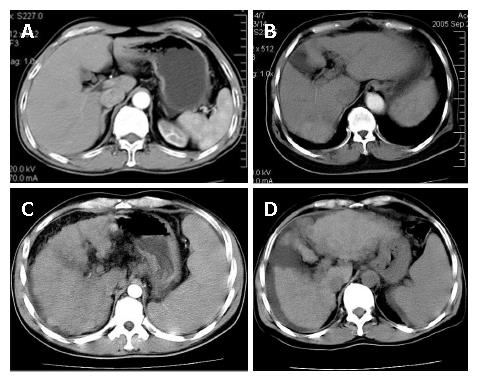
Figure 1 Grading of liver cirrhosis.
A: Equal density, normal shape, spleen index 250, and no any sign of portal vein hypertension; B: Unequal density, distorted shape with section 4 atrophy, liver fissure 1.5 cm and spleen index 360; C: Regenerating nodules density, badly trimmed contour, spleen index 620 with mild ascites, 1 cm in depth; D: More numerous regeneration nodules, indented contour, obviously atrophied volume, serious ascites, 2.2 cm in depth.
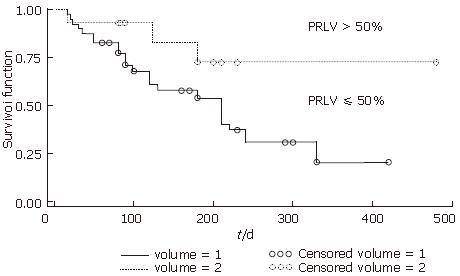
Figure 2 Survival time of two groups based on PRLV.
PRLV > 50 (volume = 2) and ≤ 50% (volume = 1); P < 0.05 between the two groups.
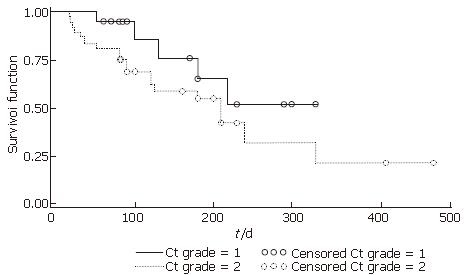
Figure 3 Survival time of two groups based on CT grades.
CT grade 1: Group of CT grade 0 and 1; CT grade 2: Group of CT grade 2 and 3. P < 0.05 between the two groups.
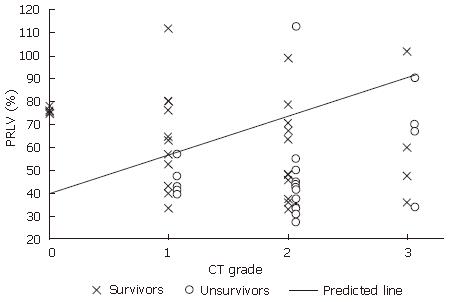
Figure 4 Distribution of survivors and nonsurvivors in the different CT grades with the different PRLV.
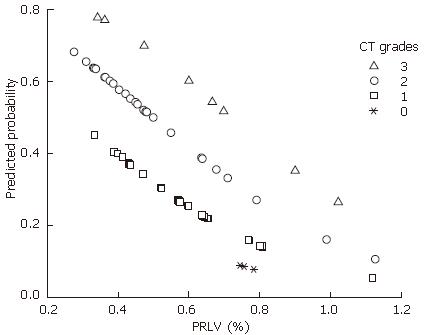
Figure 5 Distribution of the predicted probability of survival in different PRLV (%) with different CT grades.
- Citation: Tu R, Xia LP, Yu AL, Wu L. Assessment of hepatic functional reserve by cirrhosis grading and liver volume measurement using CT. World J Gastroenterol 2007; 13(29): 3956-3961
- URL: https://www.wjgnet.com/1007-9327/full/v13/i29/3956.htm
- DOI: https://dx.doi.org/10.3748/wjg.v13.i29.3956


