Copyright
©2007 Baishideng Publishing Group Co.
World J Gastroenterol. Jul 21, 2007; 13(27): 3692-3698
Published online Jul 21, 2007. doi: 10.3748/wjg.v13.i27.3692
Published online Jul 21, 2007. doi: 10.3748/wjg.v13.i27.3692
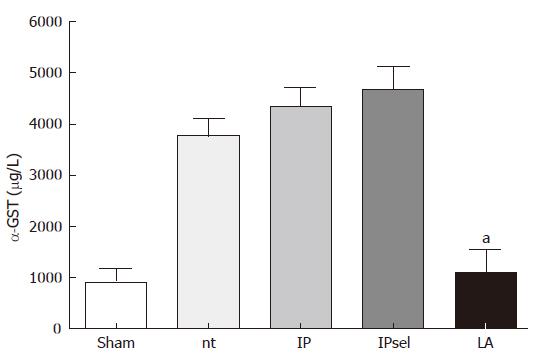
Figure 1 Plasma α-GST levels 4 h after reperfusion and 90 min of ischemia, nt: non-treated group; IP: ischemic preconditioning; IPsel: selective ischemic preconditioning, LA: lipoic acid.
aP < 0.05: significantly different vs nt.
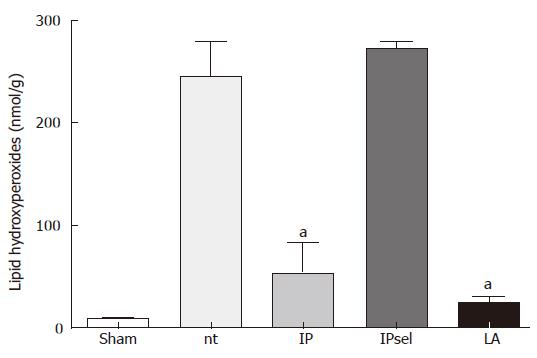
Figure 2 LPO (nmol/g) after 90 min of ischemia and 4 h of reperfusion.
nt: non-treated group; IP: ischemic preconditioning; IPsel: selective ischemic preconditioning; LA: lipoic acid. aP < 0.05: significantly different vs nt.
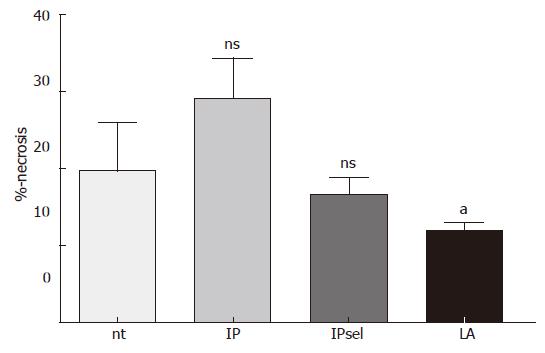
Figure 3 Percentage of necrosis as described in materials and methods after 90 min of ischemia and 4 h of reperfusion.
nt: non-treated group; IP: ischemic preconditioning; IPsel: selective ischemic preconditioning; LA: lipoic acid; aP < 0.05 significantly different vs IP; ns: not significant vs nt.
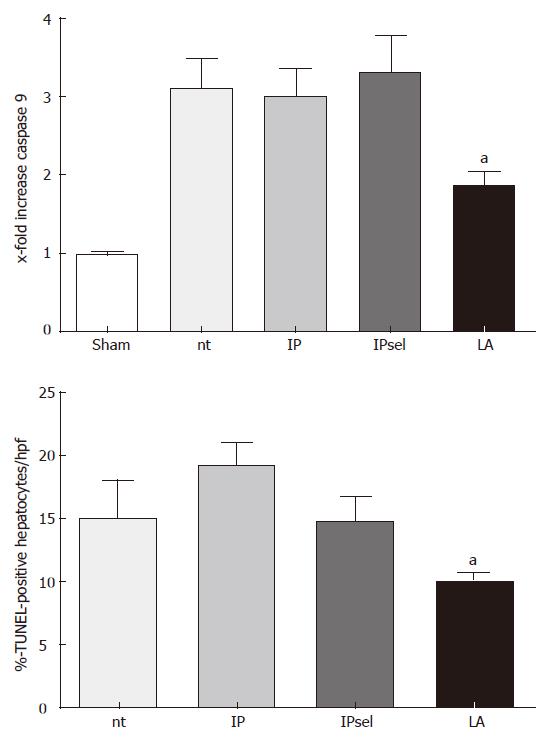
Figure 4 TUNEL-positive hepatocytes after 90 min of ischemia and 4 h of reperfusion, nt: non-treated group; IP: ischemic preconditioning; IPsel: selective ischemic preconditioning; LA: lipoic acid.
aP < 0.05 significantly different vs IP Caspase 9 activity (x-fold increase) in liver tissue after 90 min of ischemia and 4 h of reperfusion, aP < 0.05 significantly different vs nt.
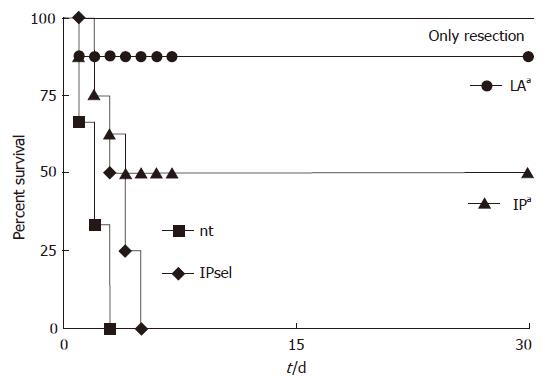
Figure 5 Kaplan and Meier survival curves after 90 min of ischemia and resection of the non-ischemic liver tissue after ischemia.
nt: no treatment; IP: ischemic preconditioning; IPsel: selective ischemic preconditioning; LA: lipoic acid: 500 μmol LA 15 min prior to ischemia. aP < 0.05 logrank comparing the survival curves only resection vs nt.
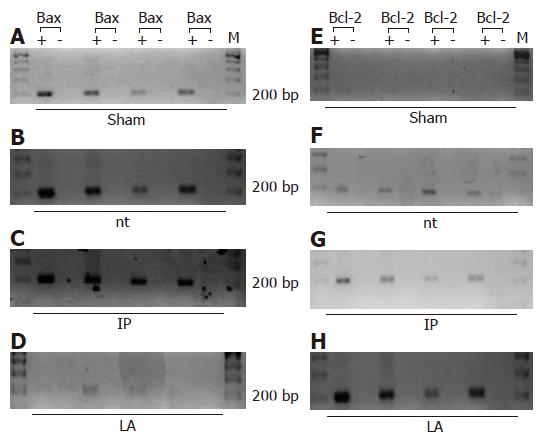
Figure 6 PCR products of Bax and Bcl-2 after 90 min of ischemia and 4 h of reperfusion.
The amounts of total RNA assayed in the groups were equal. M: DNA Marker; bp: base pairs; +: sample with reverse transcriptase; -: sample without reverse transcriptase. A,E: sham operated animals; B,F: nt : non-treated group; C,G: IP: ischemic preconditioning; D,H: LA: lipoic acid. Each horizontal lane represents one different animal of the described groups (n = 4 each group).
- Citation: Duenschede F, Erbes K, Riegler N, Ewald P, Kircher A, Westermann S, Schad A, Miesmer I, Albrecht-Schöck S, Gockel I, Kiemer AK, Junginger T. Protective effects of ischemic preconditioning and application of lipoic acid prior to 90 min of hepatic ischemia in a rat model. World J Gastroenterol 2007; 13(27): 3692-3698
- URL: https://www.wjgnet.com/1007-9327/full/v13/i27/3692.htm
- DOI: https://dx.doi.org/10.3748/wjg.v13.i27.3692


