Copyright
©2007 Baishideng Publishing Group Inc.
World J Gastroenterol. Jul 7, 2007; 13(25): 3500-3507
Published online Jul 7, 2007. doi: 10.3748/wjg.v13.i25.3500
Published online Jul 7, 2007. doi: 10.3748/wjg.v13.i25.3500
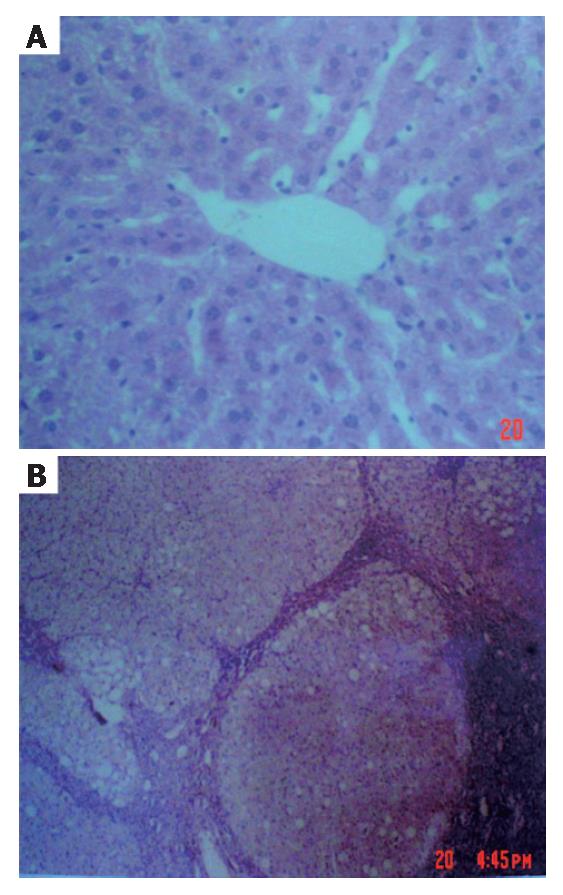
Figure 1 Histology of rat liver.
Panel A: normal liver structure showing normal sinusoids and cord located around central vein (HE, × 400); Panel B: typical liver cirrhosis with regenerative nodules of hepatocytes separated by fibrous septa (HE, × 40).
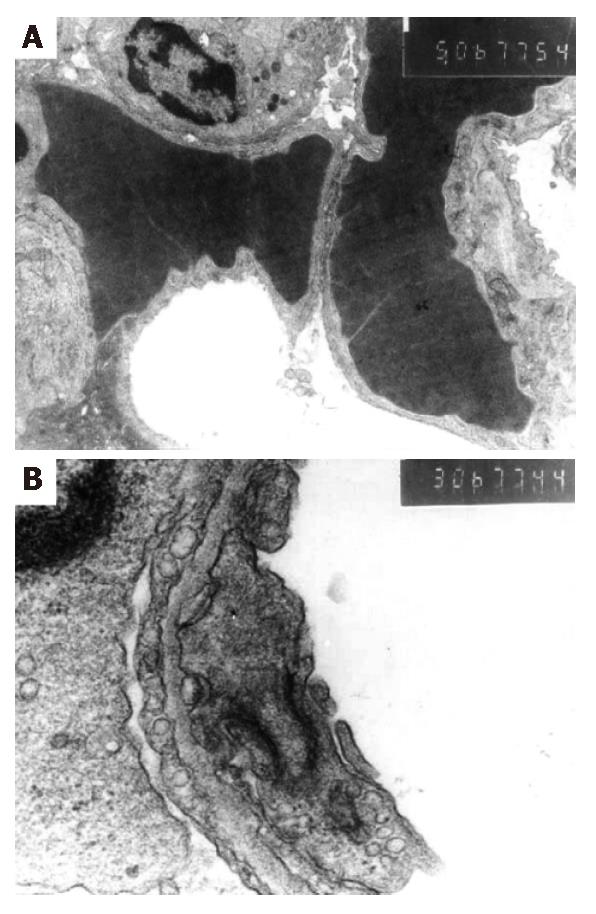
Figure 2 Electron microscopy of lung from cirrhotic liver.
Panel A: enlarged alveolar capillaries with narrowed alveolar space filled with exudates (× 6000); Panel B: destruction of the typeIalveolar epithelium, showing a discontinued zigzag lesion (× 6000).
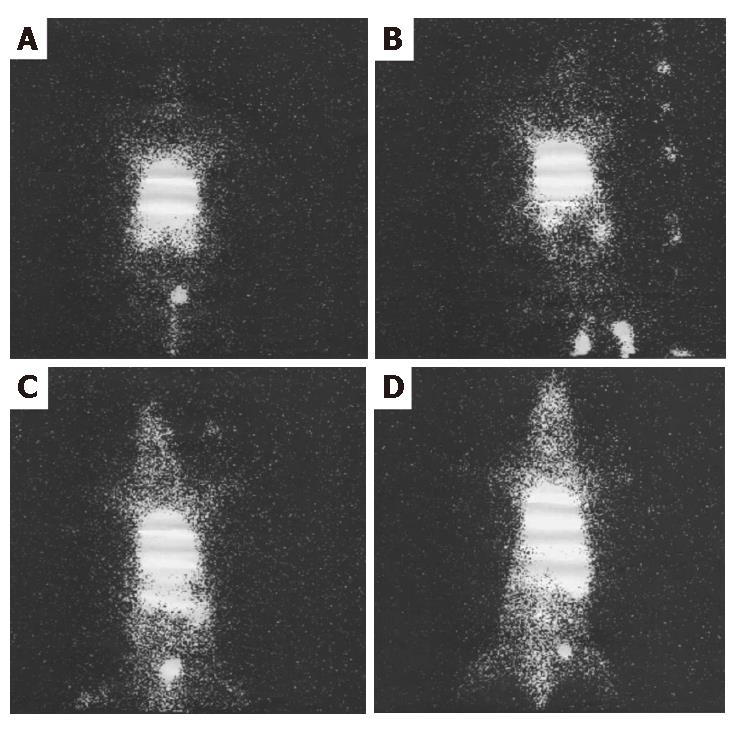
Figure 3 Tc99m-MAA scanning images of the rat brain and lung.
Panel A: representative rat from control group fed standard diet (see details in Method), showing a full distribution of Tc99m-MAA in the lung; Panel B: representative rat from the group fed standard diet plus intraperitoneal injection with lipopolysaccharide (LPS), showing slight radioactivity in the brain; Panel C: representative rat from the cirrhotic group fed a mixture of maize flour, lard, cholesterol, and alcohol plus intraperitoneal injection with carbon tetrachloride (CCl4) oil solution for 8 wk, showing significant increased radioactivity in the brain; Panel D: representative rat from cirrhotic animals plus LPS injection, showing much increased radioactivity in the brain.
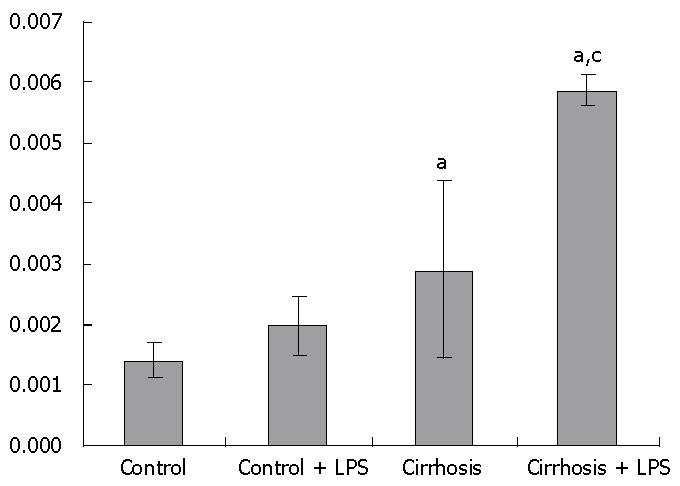
Figure 4 Ratio of brain-over-lung radioactivity in the rats.
Control, fed standard diet; LPS, fed standard diet plus LPS injection; Cirrhosis, fed a mixture of maize flour, lard, cholesterol, and alcohol plus intraperitoneal injection with carbon tetrachloride (CCl4) oil solution for 8 wk. aP < 0.05 vs normal control group; cP < 0.05 vs cirrhosis group.
- Citation: Zhang HY, Han DW, Zhao ZF, Liu MS, Wu YJ, Chen XM, Ji C. Multiple pathogenic factor-induced complications of cirrhosis in rats: A new model of hepatopulmonary syndrome with intestinal endotoxemia. World J Gastroenterol 2007; 13(25): 3500-3507
- URL: https://www.wjgnet.com/1007-9327/full/v13/i25/3500.htm
- DOI: https://dx.doi.org/10.3748/wjg.v13.i25.3500


