Copyright
©2007 Baishideng Publishing Group Inc.
World J Gastroenterol. Jul 7, 2007; 13(25): 3487-3492
Published online Jul 7, 2007. doi: 10.3748/wjg.v13.i25.3487
Published online Jul 7, 2007. doi: 10.3748/wjg.v13.i25.3487
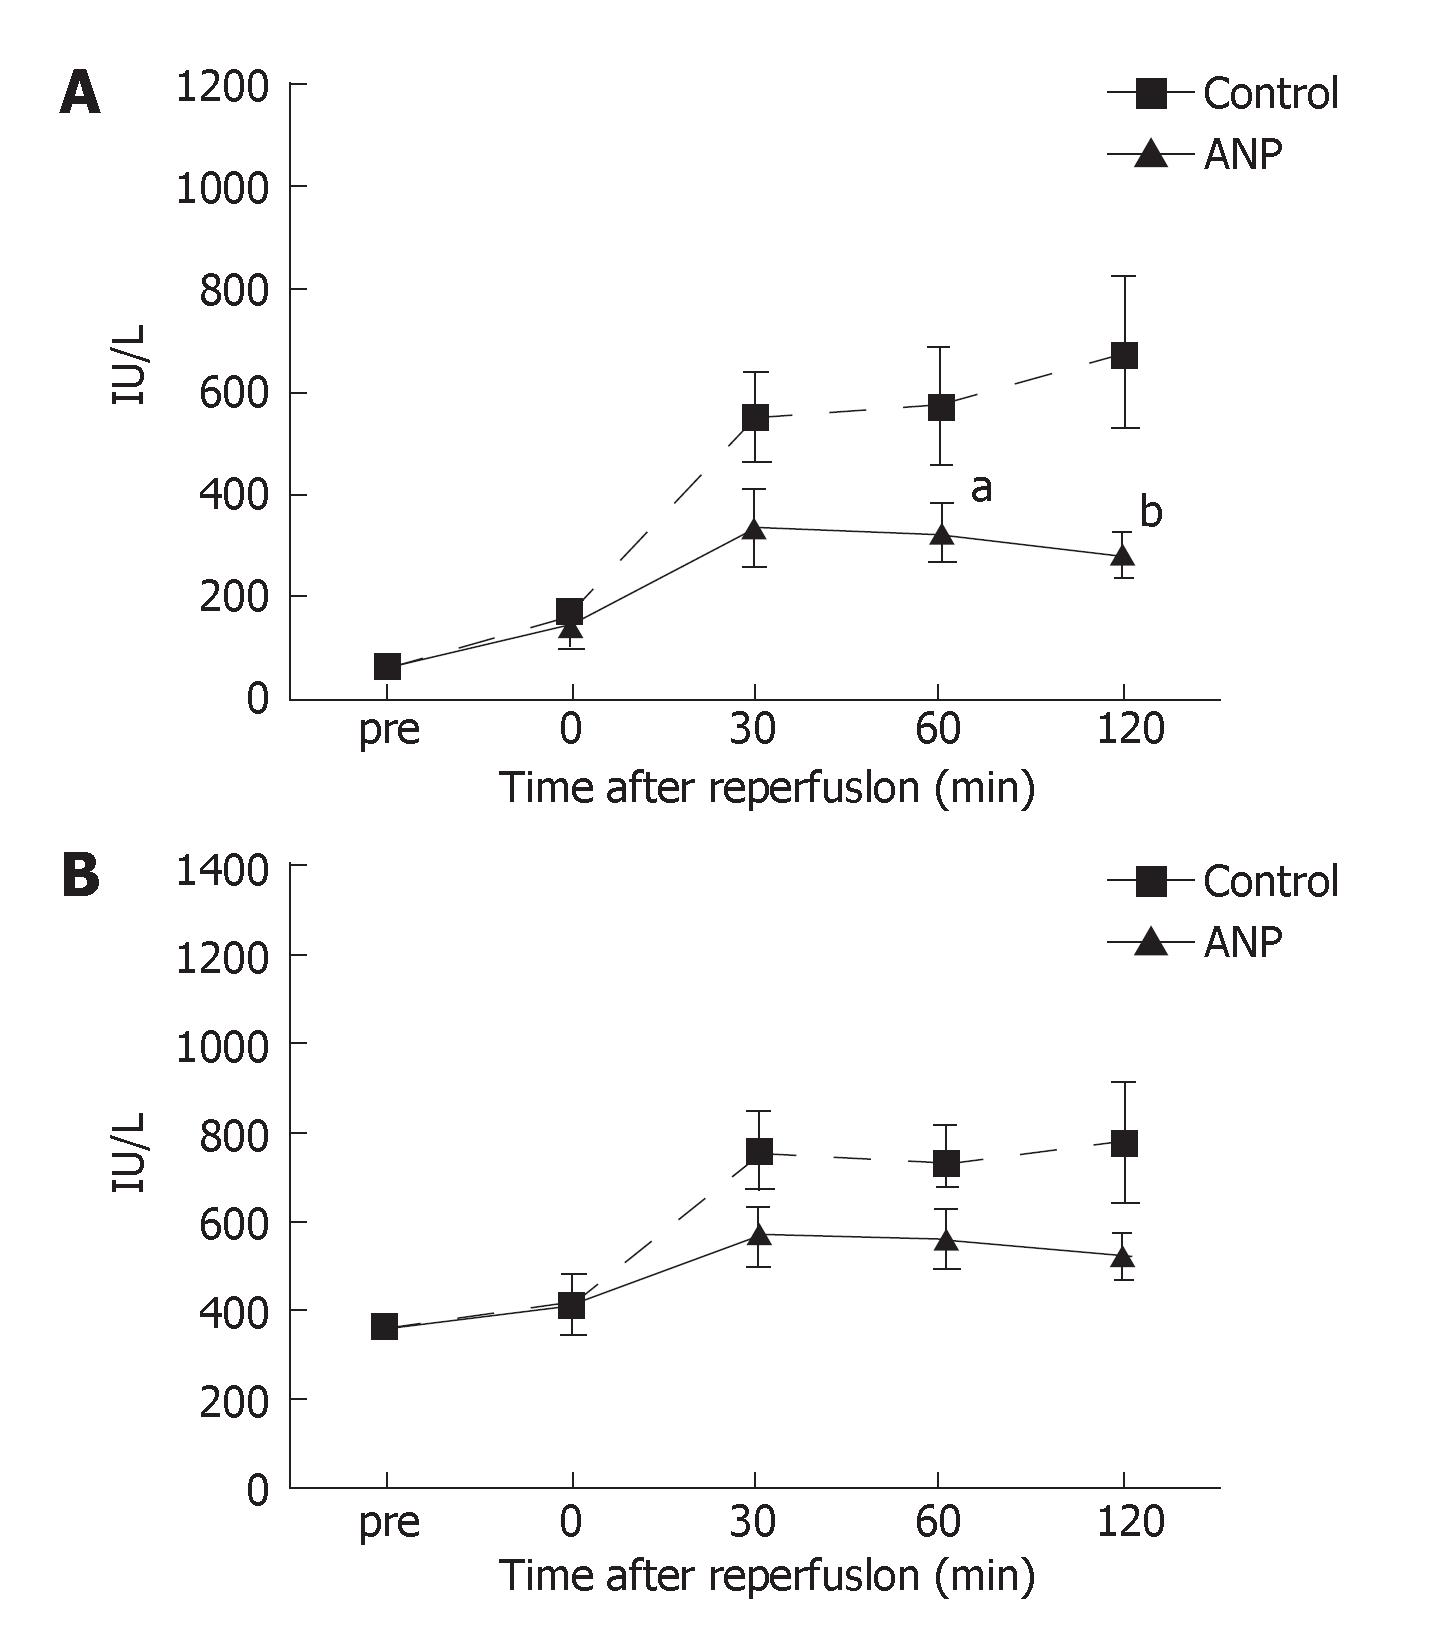
Figure 1 A: Serum AST levels before ischemia (pre) and immediately (0), 30, 60, and 120 min after reperfusion.
Data are expressed as the mean ± SE. aP < 0.05, bP < 0.01 vs control group; B: Serum LDH levels before ischemia (pre) and immediately (0), 30, 60, and 120 min after reperfusion. Data are expressed as the mean ± SE.
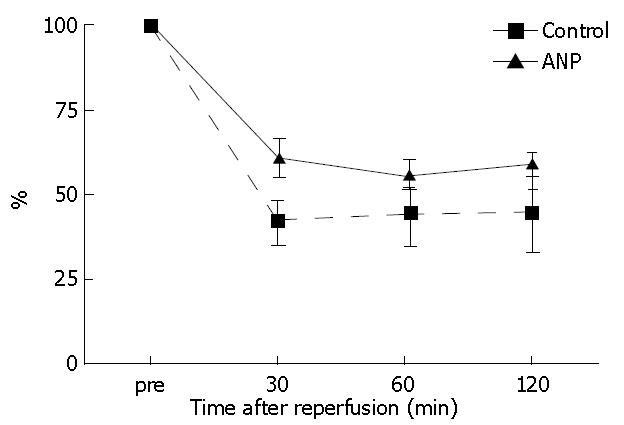
Figure 2 Hepatic tissue blood flow (HTBF) levels before ischemia (pre) and 30, 60, and 120 min after reperfusion.
The HTBF levels were evaluated as a percentage of the flow levels before ischemia.
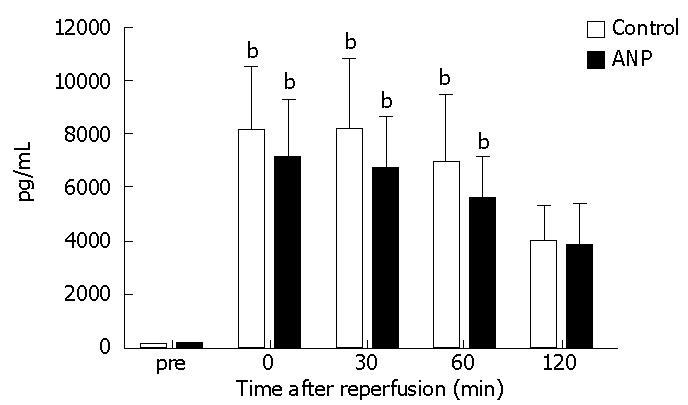
Figure 3 Serum tumor necrosis factor-α (TNF-α) levels before ischemia (pre) and immediately (0), 30, 60, and 120 min after reperfusion.
Data are expressed as the mean ± SE. bP < 0.01 vs pre levels in each group.
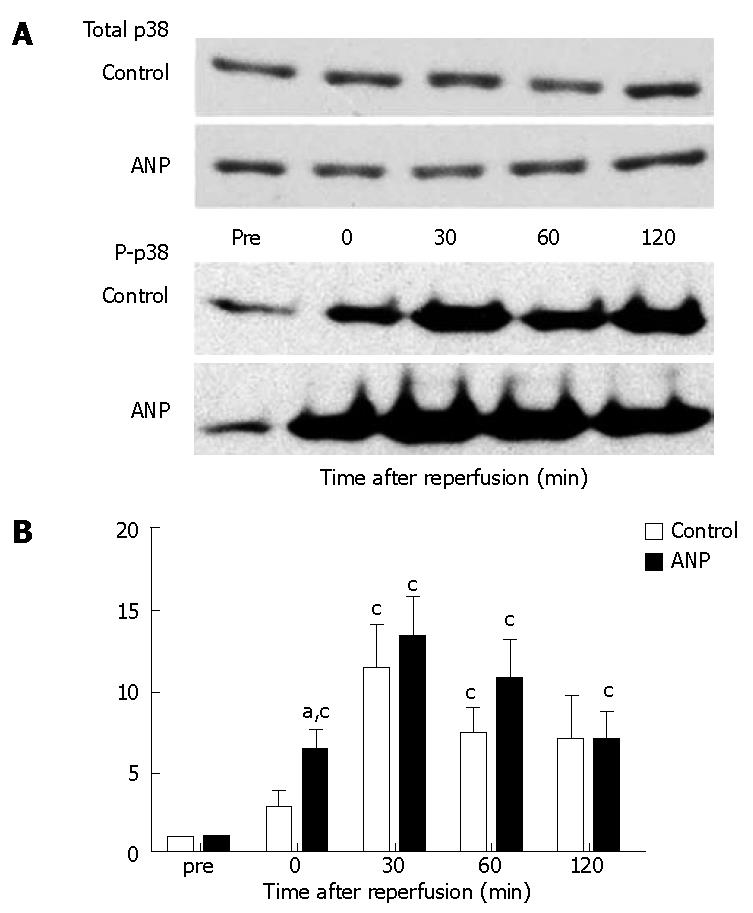
Figure 4 Western blot analysis of ischemia-reperfusion induced phosphorylation of p38 mitogen-activated protein kinase (MAPK) in the liver before ischemia (pre) and immediately (0), 30, 60, and 120 min after reperfusion.
A: Typical images are shown. The density of the bands at each point in the control and ANP groups was quantified using the ImageJ software (NIH, Bethesda, MD); B: Data are expressed as the mean ± SE. aP < 0.05 vs control group. cP < 0.05 vs pre levels in each group.
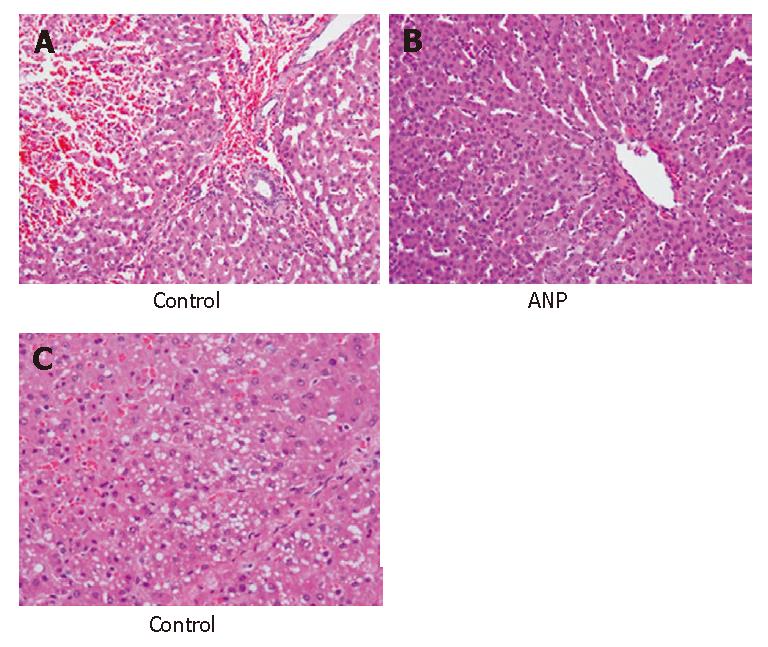
Figure 5 Histopathologic findings 120 min after reperfusion in the control group (A: HE, × 200; B: HE, × 200) and ANP group (C: HE, × 400).
- Citation: Kobayashi K, Oshima K, Muraoka M, Akao T, Totsuka O, Shimizu H, Sato H, Tanaka K, Konno K, Matsumoto K, Takeyoshi I. Effect of atrial natriuretic peptide on ischemia-reperfusion injury in a porcine total hepatic vascular exclusion model. World J Gastroenterol 2007; 13(25): 3487-3492
- URL: https://www.wjgnet.com/1007-9327/full/v13/i25/3487.htm
- DOI: https://dx.doi.org/10.3748/wjg.v13.i25.3487


