Copyright
©2007 Baishideng Publishing Group Co.
World J Gastroenterol. Jun 28, 2007; 13(24): 3323-3332
Published online Jun 28, 2007. doi: 10.3748/wjg.v13.i24.3323
Published online Jun 28, 2007. doi: 10.3748/wjg.v13.i24.3323
Figure 1 Comparison of relative mRNA levels in regenerating liver detected by Affymetrix Rat Genome 230 2.
0 microarray and real-time PCR analysis A: myc; B: jun; C: tp53; Real line represents quantitative real time PCR results; broken line indicates Rat Genome 230 2.0 microarray results.
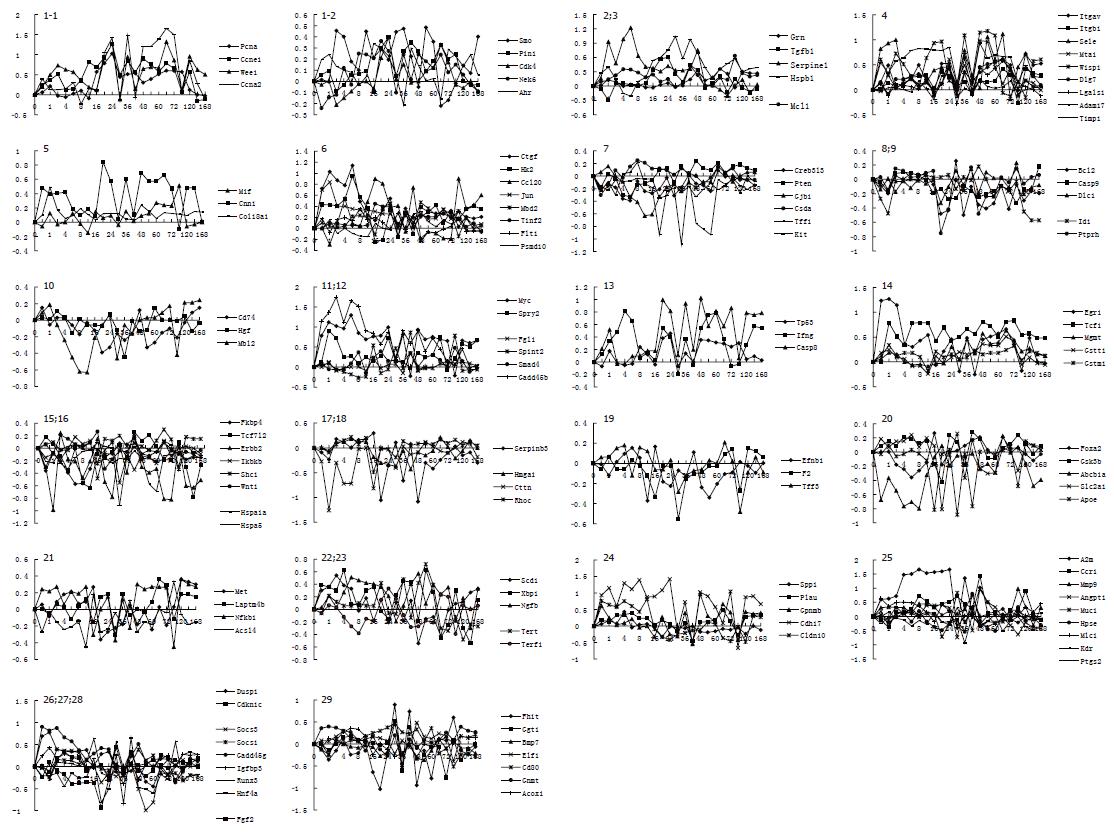
Figure 2 Correlation analysis of 121 liver tumor-associated genes with liver regeneration.
Twenty-nine subcategories were obtained by the analysis for detection data of Rat Genome 230 2.0 array with Microsoft Excel. 1-6: 34 genes up-regulated in both liver tumor (LT) and rat regenerating liver (RRL); 7-10: 14 genes down-regulated in both LT and RRL; 11-14: 14 genes down-regulated in LT but up-regulated in RRL; 15-20: 20 genes up-regulated in LT but down-regulated in RRL; 21-25: 23 up-regulated genes in LT were up-regulated at some time points and down-regulated at others in RRL; 26-29: 16 down-regulated genes in LT were up-regulated at some time points and down-regulated at others in RRL. X-axis represents recovery time after PH (h); Y-axis shows logarithm ratio of the signal values of genes at each time point to control.
- Citation: Xu CS, Zhang SB, Chen XG, Rahman S. Correlation analysis of liver tumor-associated genes with liver regeneration. World J Gastroenterol 2007; 13(24): 3323-3332
- URL: https://www.wjgnet.com/1007-9327/full/v13/i24/3323.htm
- DOI: https://dx.doi.org/10.3748/wjg.v13.i24.3323


