Copyright
©2007 Baishideng Publishing Group Co.
World J Gastroenterol. Jun 7, 2007; 13(21): 2932-2938
Published online Jun 7, 2007. doi: 10.3748/wjg.v13.i21.2932
Published online Jun 7, 2007. doi: 10.3748/wjg.v13.i21.2932
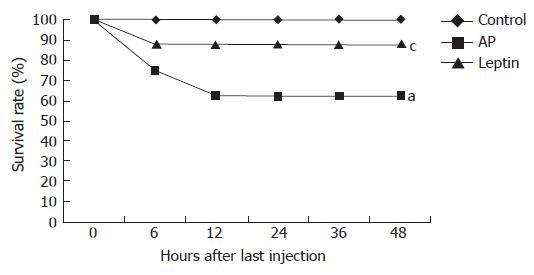
Figure 1 Effects of leptin treatment on survival rate.
(aP < 0.001 vs sham group, cP < 0.05 vs AP group).
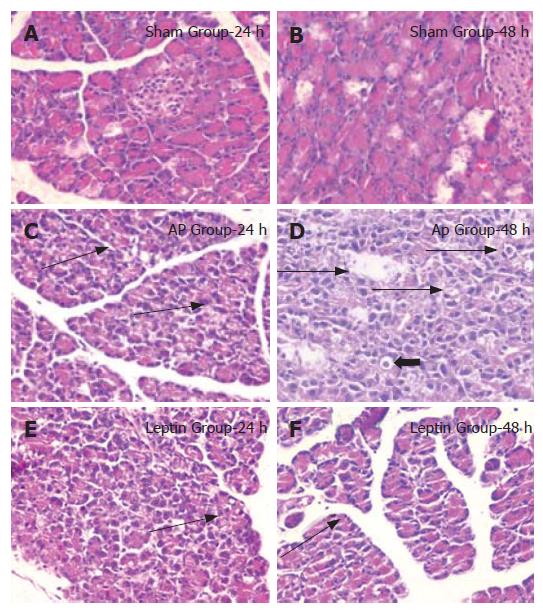
Figure 2 Light microscopy showing normal pancreatic tissue in the sham group (A, B) (HE, × 200), broad single cell necrosis (arrow) and significant increase in vacuolization (bold arrow) in the AP group at 24 h and 48 h (C, D) (HE, × 400), attenuated necrosis and vacuolization after leptin treatment at 24 h (E) (HE, × 400).
Mild edema was observed at 48 h in leptin-treated rats (F, arrow).
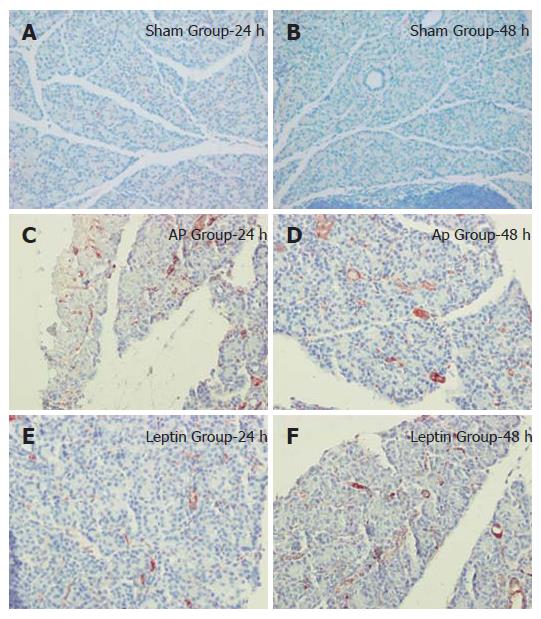
Figure 3 Immunohistochemical localization of CD40 expression in the pancreas in the sham group (A, B), AP group (C, D) and leptin group (E, F).
(Divisions A, C, E on the figure represent pulmonary sections at 24 h and B, D, F represent pulmonary sections at 48 h).
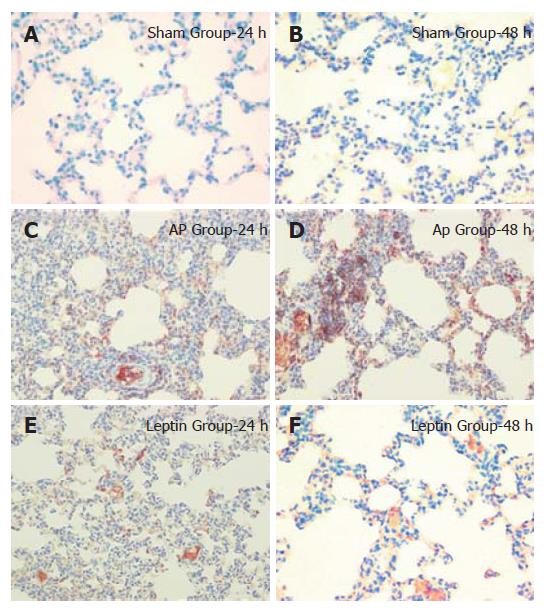
Figure 4 Immunohistochemical localization of CD40 expression in lung tissues.
There was no staining in the sham group (A, B), whereas marked staining was observed in the AP group (C, D). CD40 staining was significantly reduced in leptin-treated rats (E, F). (Divisions A, C, E on the figure represent pulmonary sections at 24 h and B, D, F represent pulmonary sections at 48 h).
- Citation: Gultekin FA, Kerem M, Tatlicioglu E, Aricioglu A, Unsal C, Bukan N. Leptin treatment ameliorates acute lung injury in rats with cerulein-induced acute pancreatitis. World J Gastroenterol 2007; 13(21): 2932-2938
- URL: https://www.wjgnet.com/1007-9327/full/v13/i21/2932.htm
- DOI: https://dx.doi.org/10.3748/wjg.v13.i21.2932


