Copyright
©2007 Baishideng Publishing Group Co.
World J Gastroenterol. May 28, 2007; 13(20): 2811-2818
Published online May 28, 2007. doi: 10.3748/wjg.v13.i20.2811
Published online May 28, 2007. doi: 10.3748/wjg.v13.i20.2811
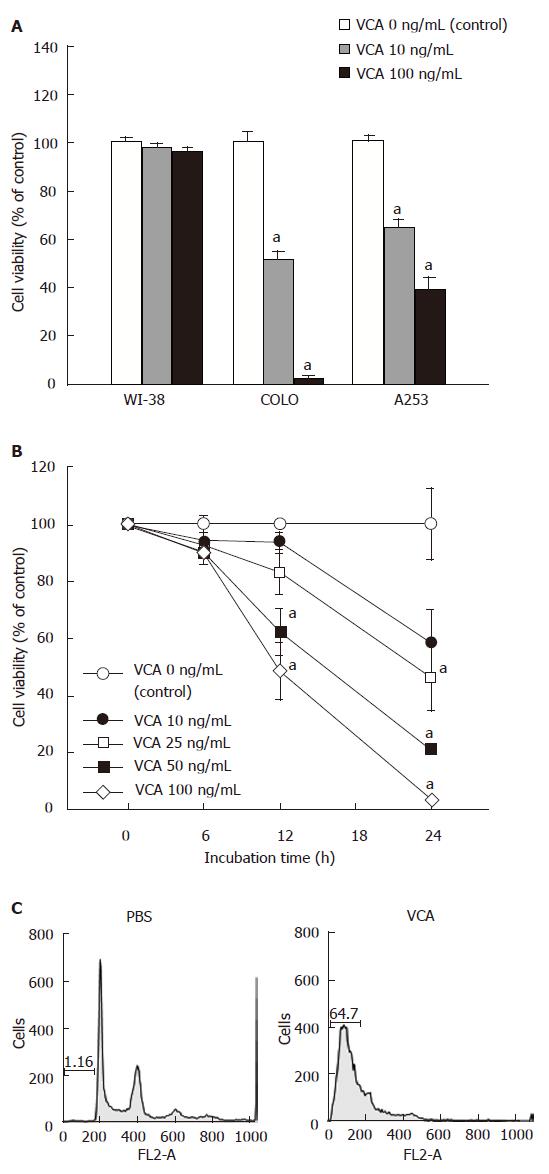
Figure 1 Cytotoxic effects of VCA on COLO cells in vitro.
A: Cells were treated with VCA for 24 h and cell viability was determined by MTT assay. Values are mean ± SE; n = 4/group; B: COLO cells were incubated with the indicated amounts of VCA for various times and cell viability was determined by MTT assay. Values are mean ± SE, n = 5/group. aP < 0.05 vs control group; C: COLO cells were treated with or without VCA (100 ng/mL) for 9 h. Cells were harvested, fixed in ethanol, and stained with propidium iodide in the presence of RNase A. The stained cells were analyzed by flow cytometry.
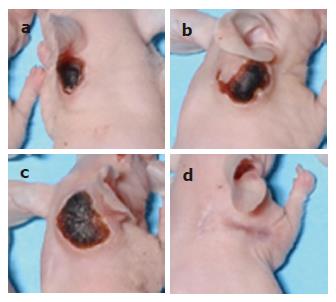
Figure 2 Tumor-killing effect of VCA in vivo.
COLO cells (1 × 10⁷ cells/mouse) were injected into the neck of CD1 nude mice. Five weeks later, VCA was injected around the developed tumors every 2 d for 5 wk. (A) The tumors were measured at 0, 1, 3 and 5 wk after VCA treatment and (B) were photographed at the end of experiment. The size of the tumors decreased (a-c) at 5 wk of treatment and eventually disappeared at 2 mo after the termination of VCA treatment (d).
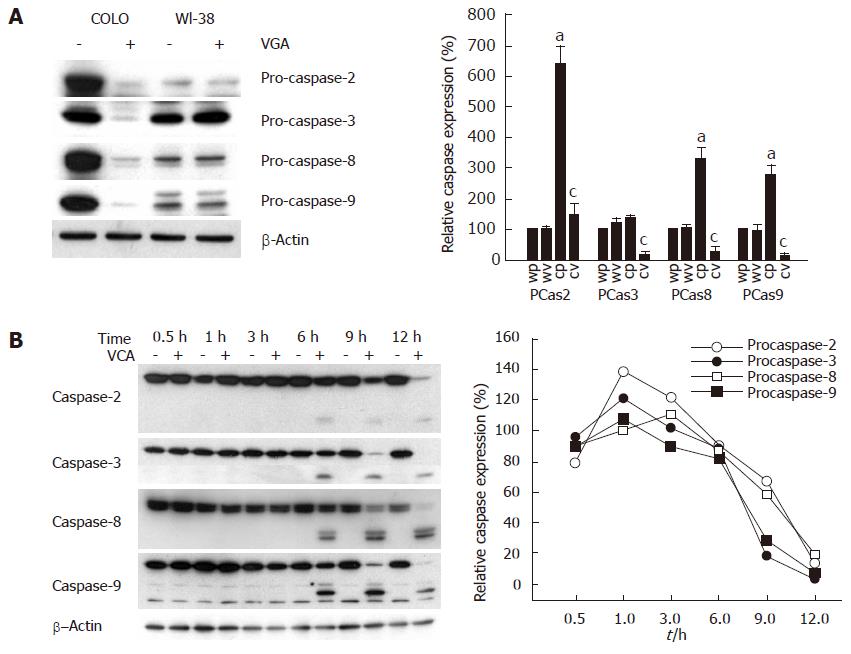
Figure 3 Activation of caspases in COLO cells treated with VCA.
A: COLO and WI-38 cells were treated without (-) or with (+) VCA (100 ng/mL) for 12 h. Cell lysates were prepared and western blots were performed using antibodies specific for each pro-caspase (PCas). Immunoreactive bands were visualized by chemiluminescence. Representative western blots are shown (left panel). Each band was quantified and normalized against the internal control (®-actin). Normalized values were used to calculate the relative expression of each procaspase as a percentage of PBS-treated WI-38 cells. WP: WI-38 cells treated with PBS, WV: WI-38 cells treated with VCA, CP: COLO cells treated with PBS, CV: COLO cells treated with VCA. Values are mean±SE of three independent experiments (right panel). aP < 0.05 vs WP. cP < 0.05 vs CP; B: COLO cells were treated without (-) or with (+) VCA (100 ng/mL) for various times and western blots were performed and quantified as described for (A). Representative western blots of three independent experiments are shown (left panel). Each band was quantified and normalized against the internal control (®-actin). Normalized values were used to calculate the relative expression of each procaspase as a percentage of COLO cells without VCA treatment at each time point (right panel).
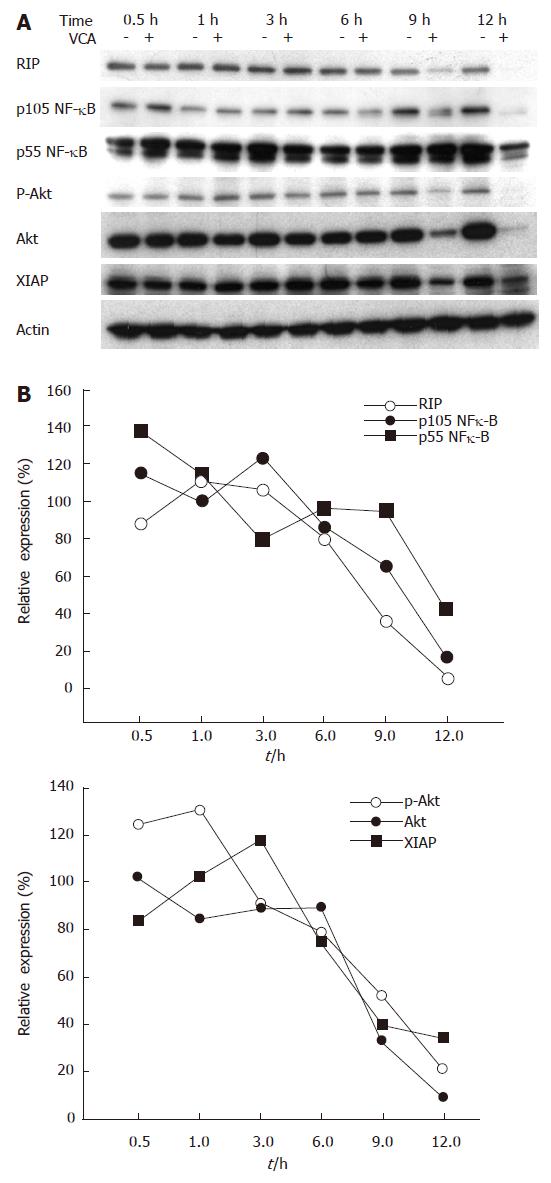
Figure 4 Decreased expression of anti-apoptotic molecules in COLO cells treated with VCA.
COLO cells were treated without (-) or with (+) VCA (100 ng/mL) for the indicated times. Cell lysates were prepared and western blots were performed using specific antibodies. Immunoreactive bands were visualized by chemiluminescence. Representative western blots are shown (A). Each band was quantified and normalized against the internal control (®-actin). Normalized values were used to calculate the relative expression as a percentage of COLO cells without VCA treatment at each time point (B). p-Akt: phosphorylated Akt. Results are representative of three independent experiments.
Figure 5 Inhibition of VCA-induced cytotoxicity of COLO cells by antagonizing anti-TNFR1 antibody (A) COLO and WI-38 cells were treated without (-) or with (+) VCA (100 ng/mL) for 12 h, cell lysates were prepared, and western blots were performed using specific antibodies.
Immunoreactive bands were visualized by chemiluminescence. Representative western blot is shown (left panel). Each band was quantified and normalized against the density of the internal control (®-actin). Normalized values were used to calculate the relative expression as a percentage of PBS-treated WI-38 cells. WP: WI-38 cells treated with PBS, WV: WI-38 cells treated with VCA, CP: COLO cells treated with PBS, CV: COLO cells treated with VCA. Values are mean±SE of three independent experiments (right panel). aP < 0.05 vs WP. cP < 0.05 vs CP. (B) COLO cells were treated without (Control) or with VCA (100 ng/mL) in the absence (PBS) or presence of the indicated amounts of antagonizing TNFR1 antibody (®-TNFR1) for 12 h. Cell viability was determined by MTT assay. Values are mean ± SE (n = 4). aP < 0.05 vs the PBS-treated control group. cP < 0.05 vs the PBS/VCA-treated group.
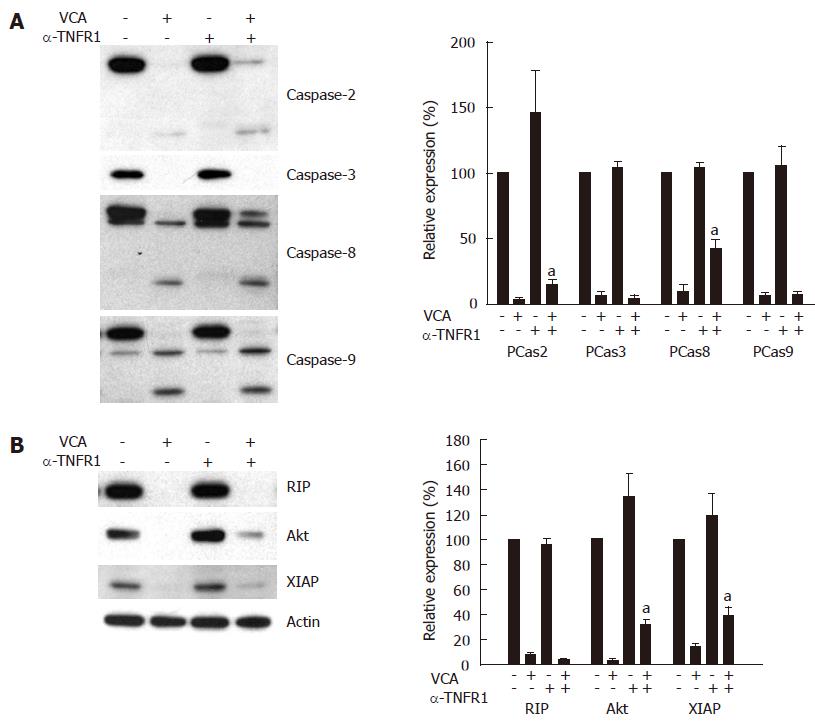
Figure 6 Inhibition of VCA-induced caspase activation and VCA-induced decrease of anti-apoptotic molecules in COLO cells treated with anti-TNFR1 antibody.
COLO cells were treated without (-) or with (+) VCA (100 ng/mL) for 12 h in the presence (+) or absence (-) of anti-TNFR1 antibody (α-TNFR1, 10 μg/mL). Cell lysates were prepared and western blot was performed using specific antibodies for (A) various procaspases (PCas) and (B) anti-apoptotic molecules. Immunoreactive bands were visualized by chemiluminescence. Representative western blot is shown (left panels). Each band was quantified and normalized against the density of the internal control (actin). Normalized values were used to calculate the relative expression as a percentage of COLO cells without VCA or anti-TNFR1 antibody treatment. Values are mean ± SE of three independent experiments (right panels). aP < 0.05 vs VCA-treated cells without anti-TNFR1.
- Citation: Khil LY, Kim W, Lyu S, Park WB, Yoon JW, Jun HS. Mechanisms involved in Korean mistletoe lectin-induced apoptosis of cancer cells. World J Gastroenterol 2007; 13(20): 2811-2818
- URL: https://www.wjgnet.com/1007-9327/full/v13/i20/2811.htm
- DOI: https://dx.doi.org/10.3748/wjg.v13.i20.2811


