Copyright
©2007 Baishideng Publishing Group Co.
World J Gastroenterol. Jan 14, 2007; 13(2): 270-275
Published online Jan 14, 2007. doi: 10.3748/wjg.v13.i2.270
Published online Jan 14, 2007. doi: 10.3748/wjg.v13.i2.270
Figure 1 Schematic outline of study protocol.
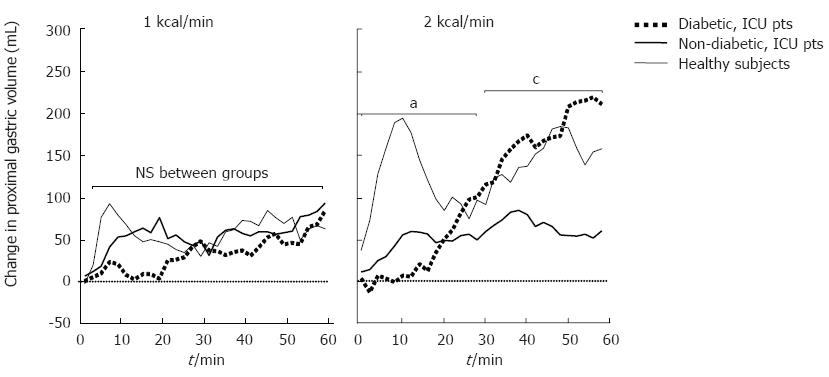
Figure 2 Changes in proximal gastric volume during duodenal nutrient stimulation (1 and 2 kcal/min) in critically ill patients and healthy subjects.
aP < 0.05, ICU patients vs healthy subjects during 0-30 min; cP < 0.05, non-DM patients vs diabetic patients and healthy subjects during 30- 60 min
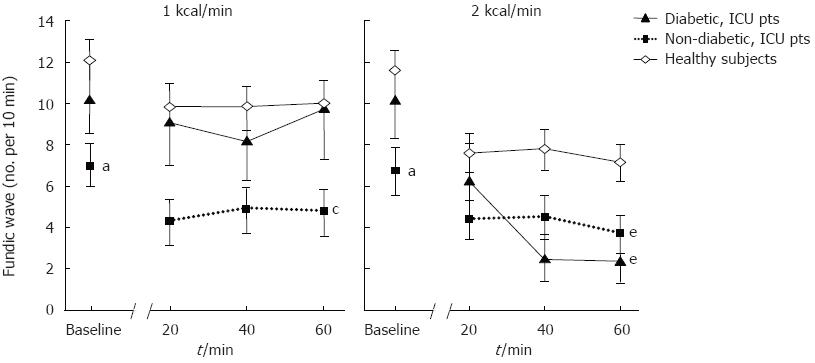
Figure 3 Frequency of fundic slow wave contractions at baseline and during duodenal nutrient infusion (1 and 2 kcal/min) in critically ill patients and healthy subjects.
aP < 0.05 vs healthy subjects and diabetic patients at baseline; cP < 0.05 vs healthy subjects and diabetic patients during 1 kcal infusion; eP < 0.05 vs healthy subjects during 2 kcal infusion.
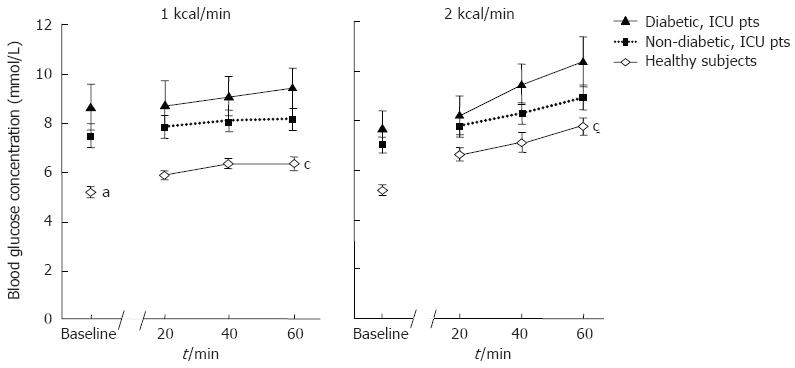
Figure 4 Blood glucose concentration at baseline and during nutrient infusion in critically ill patients and healthy subjects.
aP < 0.05 vs critically ill patients at baseline; cP < 0.05 vs critically ill patients during nutrient infusion.
- Citation: Nguyen NQ, Fraser RJ, Bryant LK, Chapman M, Holloway RH. Proximal gastric motility in critically ill patients with type 2 diabetes mellitus. World J Gastroenterol 2007; 13(2): 270-275
- URL: https://www.wjgnet.com/1007-9327/full/v13/i2/270.htm
- DOI: https://dx.doi.org/10.3748/wjg.v13.i2.270


