Copyright
©2007 Baishideng Publishing Group Co.
World J Gastroenterol. Jan 14, 2007; 13(2): 236-243
Published online Jan 14, 2007. doi: 10.3748/wjg.v13.i2.236
Published online Jan 14, 2007. doi: 10.3748/wjg.v13.i2.236
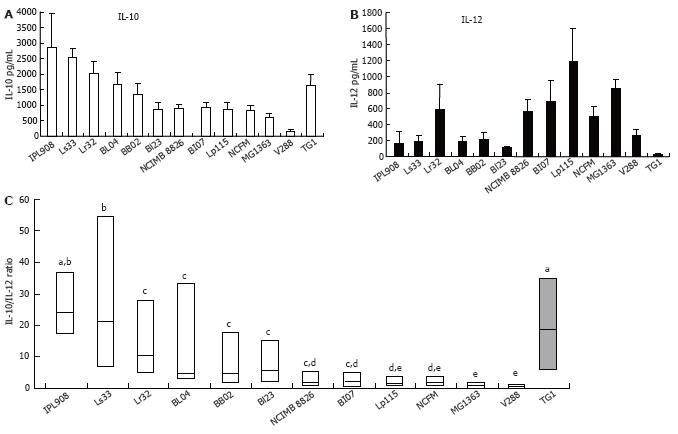
Figure 1 Strain-specific patterns of IL-10 (A) and IL-12p70 (B) release for various bacterial strains and IL-10/IL-12 ratios (C) for 6 to 12 independent healthy donors.
Bars represent the mean ± SE values in pg/mL for 6 to 12 independent healthy donors. Ranked box and whisker plots show the median values and first to third quartiles in boxes. Different letters indicate significant differences according to Mann-Whitney U test (P < 0.05).
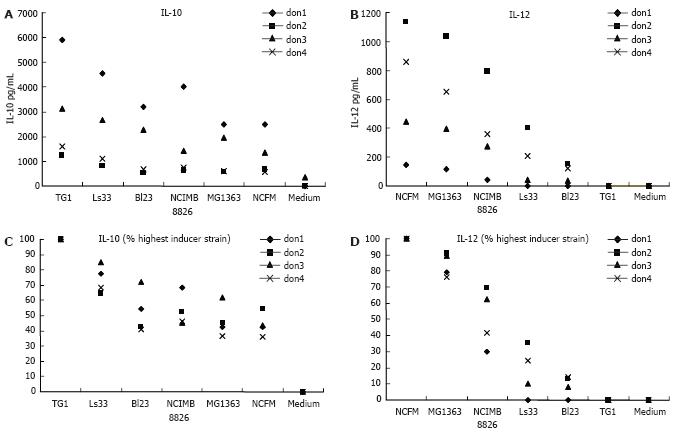
Figure 2 IL-10 (A) and IL-12p70 (B) release in 4 distinct individual human PBMC donors and the expression level of IL-10 (C) and IL-12p70 (D).
Individual values are represented in pg/mL while IL-10 and IL-12p70 levels are expressed as % of the highest inducer strain. aP < 0.05.
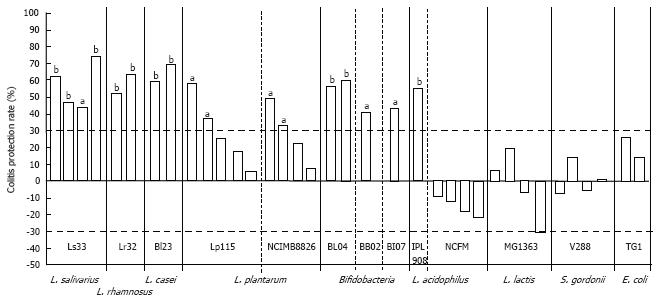
Figure 3 Protective effect of LAB strains against TNBS-induced colitis in BALB/c mice.
Results are expressed as a % reduction of the mean macroscopic inflammation of mice treated with LAB as compared to the mean score of non-treated mice. Colitis index was assessed 48 h after TNBS administration. Each bar represents an independent experiment and corresponds to the ratio of control and LAB-treated mice groups (n = 10). aP < 0.05, bP < 0.01 vs TNBS-control group. The horizontal dashed lines indicate the 30% threshold of the uncertain statistical significance.
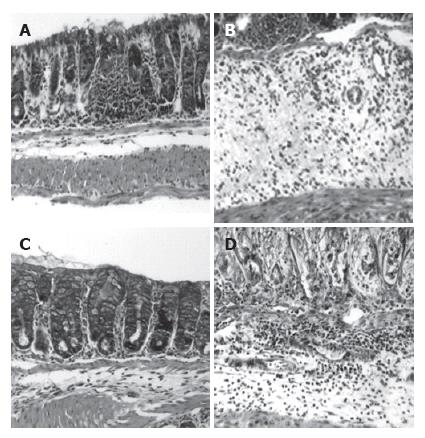
Figure 4 Hematoxylin/eosin staining of representative cross-sections of murine (BALB/c) distal colon (HE, x 20).
A: Normal appearance of the colon from a negative control mice; B: Thickening of the colon wall accompanied with massive inflammatory infiltrate and muscular necrosis 2 d after TNBS-induction of colitis; C: Reduction of histological damage in L. salivarius Ls33-treated mice after TNBS administration; D: Lack of histological improvement of colitis in L. acidophilus NCFM-treated mice after TNBS administration.
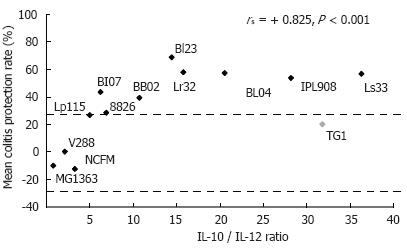
Figure 5 Correlation between the average protection against experimental colitis and the mean IL-10/IL-12 ratios obtained in vitro, for all investigated strains.
Spearman coefficient (rs = 0.825, P < 0.001). The horizontal dashed lines indicate the 30% threshold of unprotectiveness.
-
Citation: Foligne B, Nutten S, Grangette C, Dennin V, Goudercourt D, Poiret S, Dewulf J, Brassart D, Mercenier A, Pot B. Correlation between
in vitro andin vivo immunomodulatory properties of lactic acid bacteria. World J Gastroenterol 2007; 13(2): 236-243 - URL: https://www.wjgnet.com/1007-9327/full/v13/i2/236.htm
- DOI: https://dx.doi.org/10.3748/wjg.v13.i2.236


