Copyright
©2007 Baishideng Publishing Group Inc.
World J Gastroenterol. May 14, 2007; 13(18): 2615-2618
Published online May 14, 2007. doi: 10.3748/wjg.v13.i18.2615
Published online May 14, 2007. doi: 10.3748/wjg.v13.i18.2615
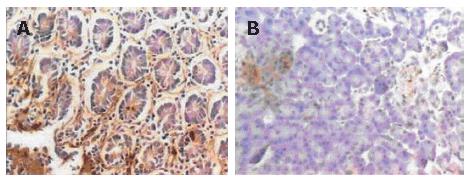
Figure 1 Immunohistochemical analysis of PDX-1 expression in different tissues.
A: PDX-1-positive cells in pancreatic cancers and located at the leading edge of infiltration; B: Weekly expressed PDX-1 in beta cells but not in ductal cells.
Figure 2 Western blot analysis of PDX-1 expression in different tissues.
M: Marker; C: Pancreatic cancer; N: Normal pancreas tissue.
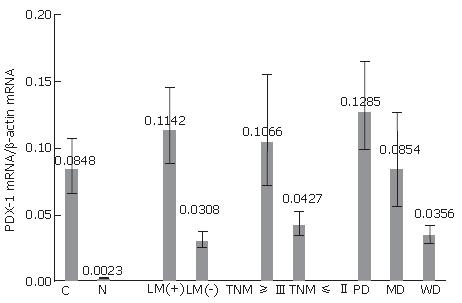
Figure 3 Correlations of PDX-1 mRNA expression with tumor characteristics.
C: Cancer tissue; N: Normal tissues; LM: Lymph node metastasis; TNM: TNM staging; PD: Poorly differentiated; MD: Moderately differentiated, WD: Well differentiated.
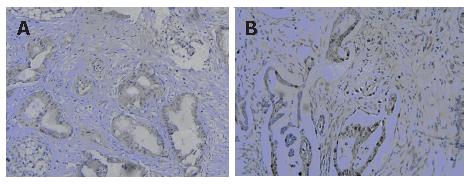
Figure 4 Expression of PCNA in pancreatic cancer tissues.
A: PCNA-positive cells, mainly duct-like cells; B: The proportion of PCNA-positive cells is higher in leading edge of infiltration.
- Citation: Liu T, Gou SM, Wang CY, Wu HS, Xiong JX, Zhou F. Pancreas duodenal homeobox-1 expression and significance in pancreatic cancer. World J Gastroenterol 2007; 13(18): 2615-2618
- URL: https://www.wjgnet.com/1007-9327/full/v13/i18/2615.htm
- DOI: https://dx.doi.org/10.3748/wjg.v13.i18.2615


