Copyright
©2007 Baishideng Publishing Group Inc.
World J Gastroenterol. May 14, 2007; 13(18): 2575-2580
Published online May 14, 2007. doi: 10.3748/wjg.v13.i18.2575
Published online May 14, 2007. doi: 10.3748/wjg.v13.i18.2575
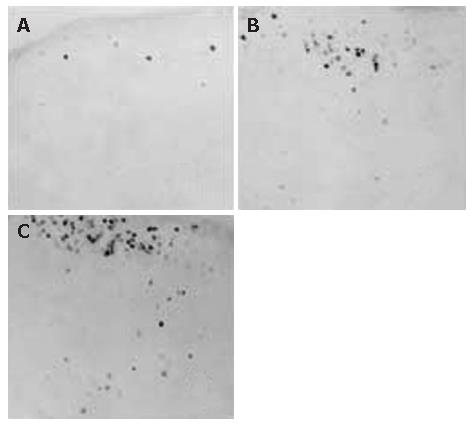
Figure 1 Expression of c-Fos in the cervical cord.
A: Control group; B: Model group at 3 mo; C: Model group at 5 mo. There were only a few c-Fos expression in the cervical cord of the control group, but an increased c-Fos expression in the model groups at 3 mo and 5 mo after the operation.
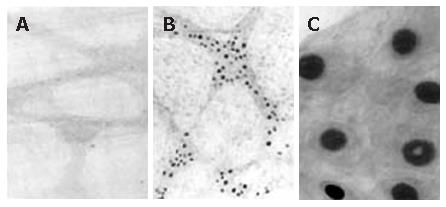
Figure 2 Expression of c-Fos in the gastric antrum.
A: Control group; B: Model group; C: Enlarged figure of the model group. Neurons were defined as c-Fos-positive when the nucleus was stained with intensity clearly above the faint background stain, whereas neurons were defined as c-Fos-negative when the nucleus was either not stained at all or stained with intensity close to background stain.
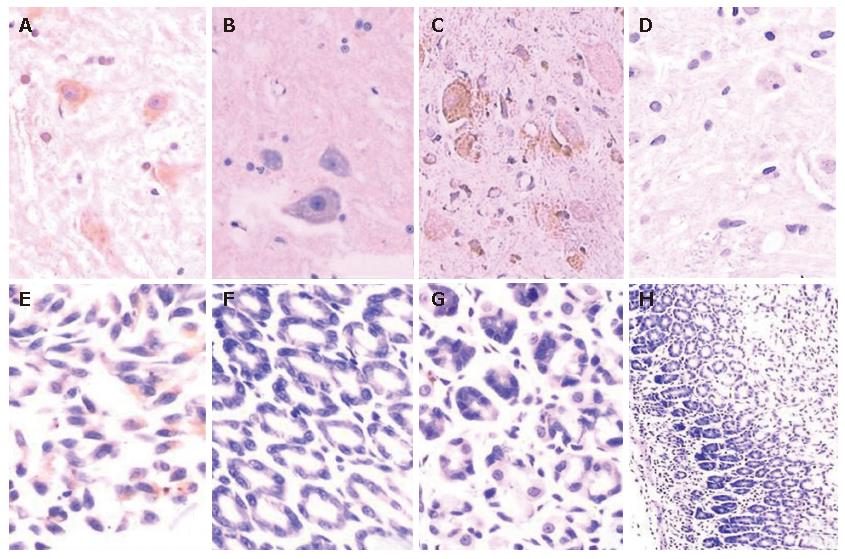
Figure 3 Expression of caspase-3 and IL-1β in the cervical cord and stomach.
A: An increased immunoreactivity and positive neurons of IL-1β in model group; B: Negative expression of IL-1β in control group; C: An increased expression of caspase-3 in model group; D: Negative immunoreactivity of caspase-3 in control group; E: Positive expression of IL-1β in the stomach of model group; F: Negative expression of IL-1β in the stomach of control group; G: An increased expression of caspase-3 in the stomach of model group; H: Negative immunoreactivity of caspase-3 in the stomach of control group.
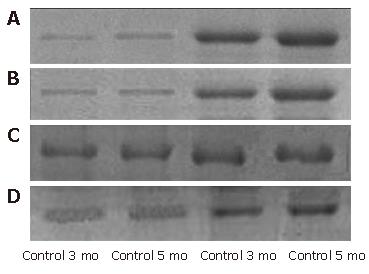
Figure 4 Expression of caspase-3 and IL-1β protein detected by Western blot.
A: Caspase-3 expression in the cord at 3 mo and 5 mo in different groups; B: IL-1β expression in the cord at 3 mo and 5 mo in different groups; C: Caspase-3 expression in the gastric antrum at 3 mo and 5 mo in different groups; D: IL-1β expression in the gastric antrum at 3 mo and 5 mo in different groups.
- Citation: Song XH, Xu XX, Ding LW, Cao L, Sadel A, Wen H. A preliminary study of neck-stomach syndrome. World J Gastroenterol 2007; 13(18): 2575-2580
- URL: https://www.wjgnet.com/1007-9327/full/v13/i18/2575.htm
- DOI: https://dx.doi.org/10.3748/wjg.v13.i18.2575


