Copyright
©2007 Baishideng Publishing Group Co.
World J Gastroenterol. Apr 28, 2007; 13(16): 2352-2356
Published online Apr 28, 2007. doi: 10.3748/wjg.v13.i16.2352
Published online Apr 28, 2007. doi: 10.3748/wjg.v13.i16.2352
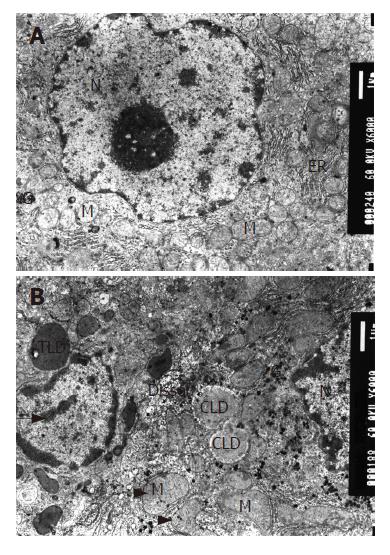
Figure 1 Mitochondria appearance under electron microscope (EM × 6000); A: Mitochondria in normal group; B: Mitochondria in model group.
M: mitochondria, G: glycogen, N nucleus, ER: endoplasmic reticulum, LD: lipid droplet. The long arrow shows abnormally distributed chromatin in nuclei, the short one is megamitochondrion and the arrow head is U-type mitochondria.
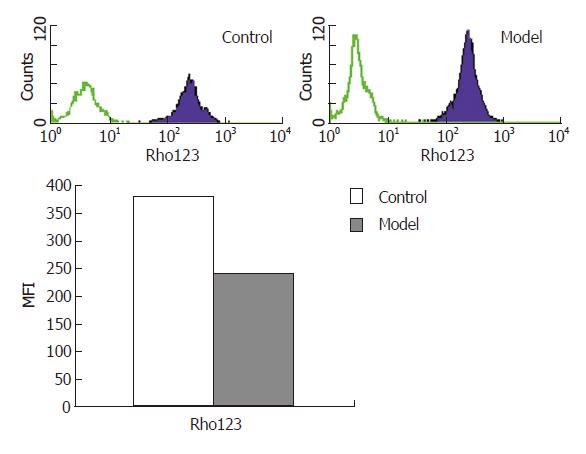
Figure 2 Mitochondrial membrane potential detected by flow cytometry.
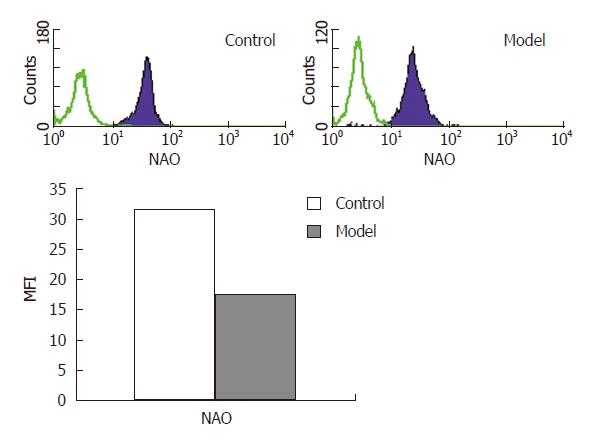
Figure 3 Mitochondria mass detected by flow cytometry.
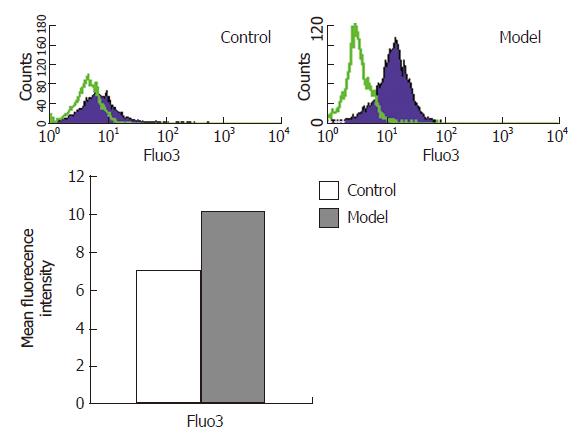
Figure 4 Intracellular calcium concentrations in hepatocytes detected by flow cytometry.
- Citation: Yan M, Zhu P, Liu HM, Zhang HT, Liu L. Ethanol induced mitochondria injury and permeability transition pore opening: Role of mitochondria in alcoholic liver disease. World J Gastroenterol 2007; 13(16): 2352-2356
- URL: https://www.wjgnet.com/1007-9327/full/v13/i16/2352.htm
- DOI: https://dx.doi.org/10.3748/wjg.v13.i16.2352


