Copyright
©2007 Baishideng Publishing Group Co.
World J Gastroenterol. Apr 28, 2007; 13(16): 2289-2297
Published online Apr 28, 2007. doi: 10.3748/wjg.v13.i16.2289
Published online Apr 28, 2007. doi: 10.3748/wjg.v13.i16.2289
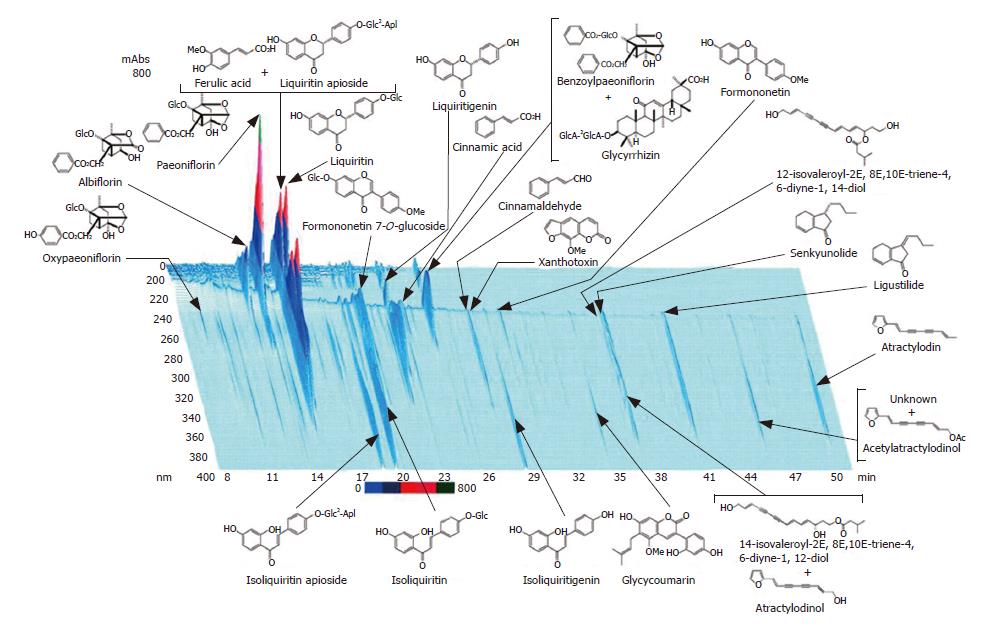
Figure 1 Chemical profile of JTX product analyzed by three-dimensional HPLC.
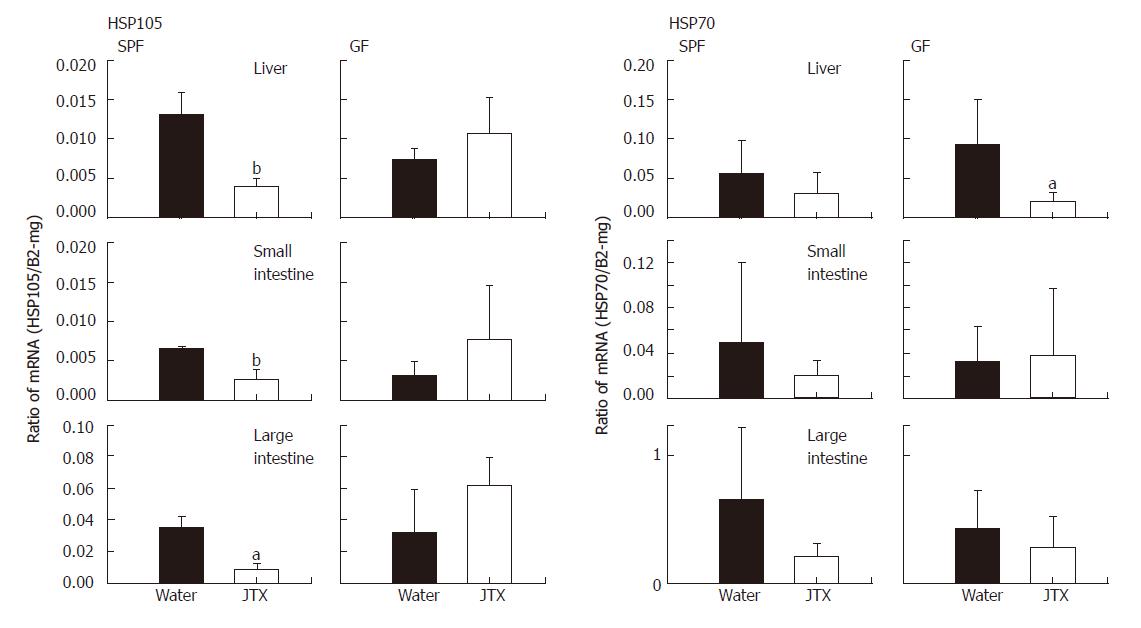
Figure 2 Effect of JTX (1 g/kg body weight for 2 wk) on the expression of HSP105 and HSP70 mRNA in the liver, small intestine and large intestine detected by real-time RT-PCR in SPF and GF IQI mice (n = 5, mean ± SD, aP < 0.
05, bP < 0.01 vs water).
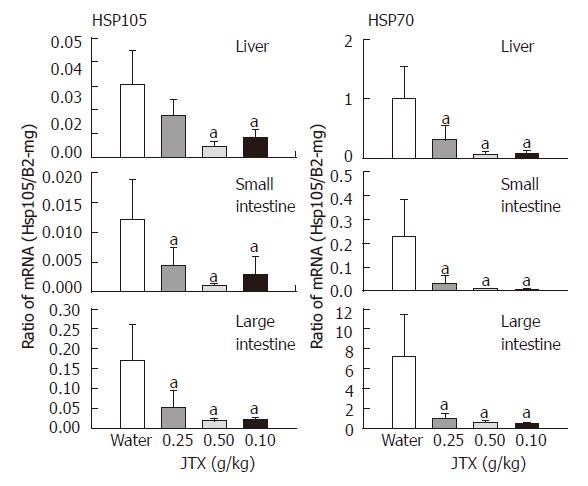
Figure 3 Effect of JTX (0.
25, 0.5 and 1 g/kg body weight for 2 wk) on the expression of HSP105 and HSP70 mRNA detected by real-time RT-PCR in the liver, small intestine and large intestine in ICR mice (n = 4-5; mean ± SD, aP < 0.05 vs water).
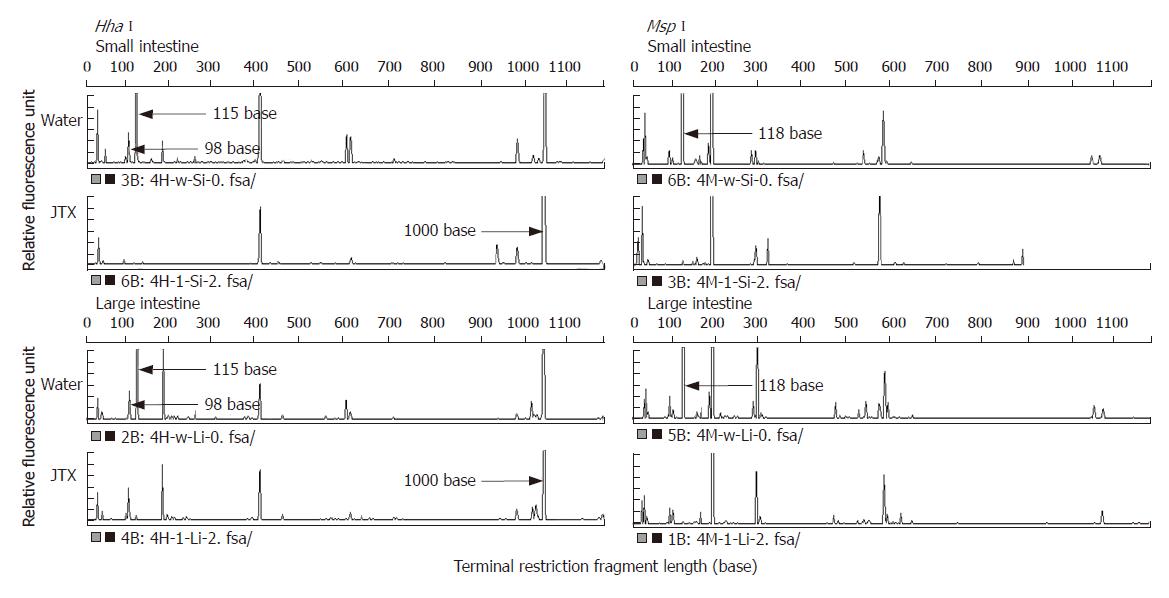
Figure 4 Change of the intestinal microflora in JTX-treated SPF ICR mice assessed by T-RFLP analysis digested with HhaI and MspI (n = 5).
The arrows indicate the remarkably changed peaks. Even though it is not clear that 1000-base peak was increased in the HhaI restricted fragments in this scale, it is obviously increased when the scale is changed.
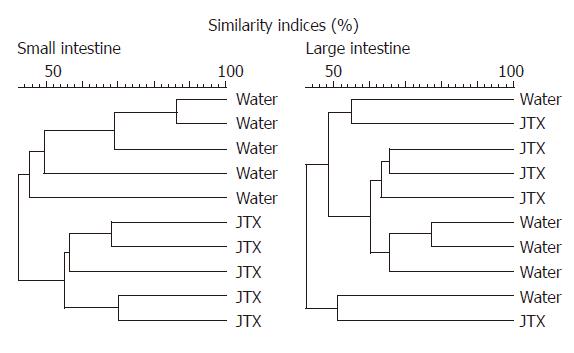
Figure 5 Dendrogram analysis of the intestinal microflora based on T-RFLP.
Jaccard matching coefficients was performed and UPGMA were used as the dendrogram type.
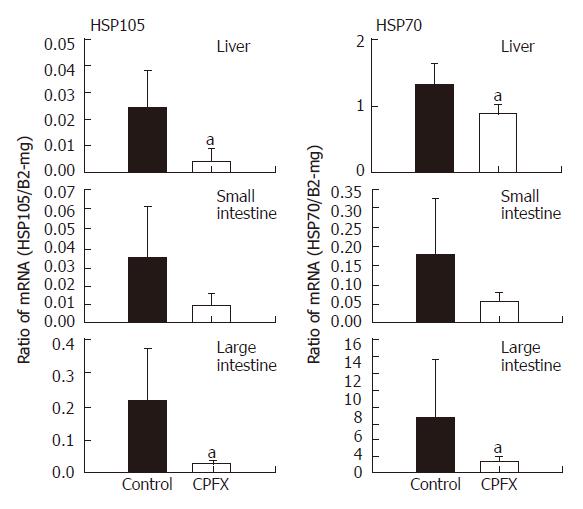
Figure 6 Real-time RT-PCR showing the change of expression of HSP105 and HSP70 mRNA in the liver, small intestine and large intestine of mice by the administration of CPFX in SPF ICR mice (n = 5, mean ± SD, aP < 0.
05, bP < 0.01 vs control).
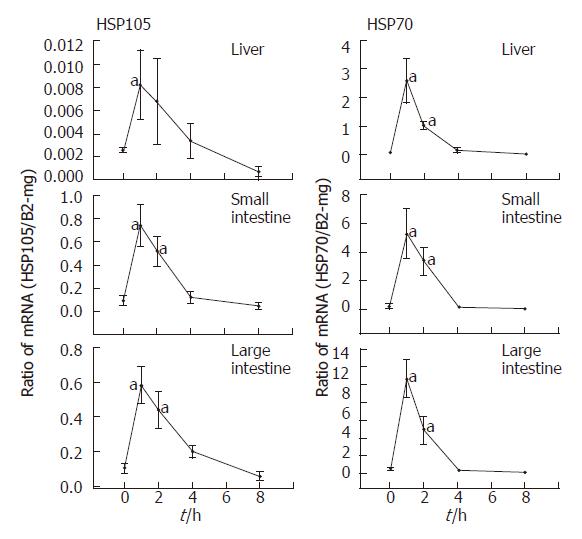
Figure 7 Induction of HSP105 and HSP70 mRNA by sodium arsenite detected by real-time RT-PCR in the liver, small intestine and large intestine of mice (n = 3, mean ± SD, aP < 0.
05 vs 0-h value).
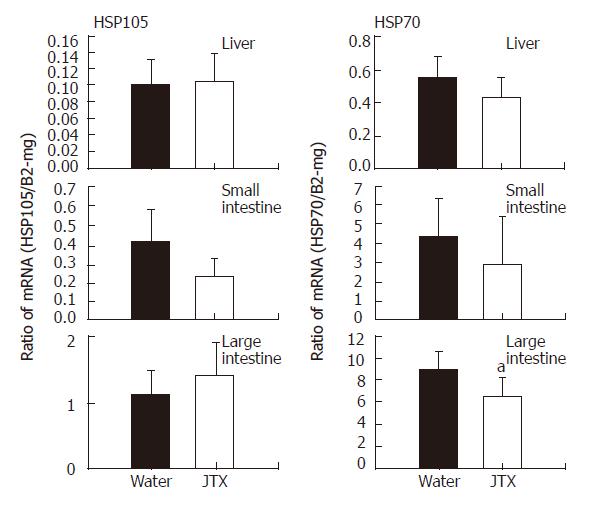
Figure 8 Effect of JTX on HSP105 and HSP70 induction by sodium arsenite detected by real-time RT-PCR in the liver, small intestine and large intestine of SPF ICR mice (n = 6, mean ± SD, aP < 0.
05, bP < 0.01 vs water).
- Citation: Kato M, Ishige A, Anjiki N, Yamamoto M, Irie Y, Taniyama M, Kibe R, Oka J, Benno Y, Watanabe K. Effect of herbal medicine Juzentaihoto on hepatic and intestinal heat shock gene expression requires intestinal microflora in mouse. World J Gastroenterol 2007; 13(16): 2289-2297
- URL: https://www.wjgnet.com/1007-9327/full/v13/i16/2289.htm
- DOI: https://dx.doi.org/10.3748/wjg.v13.i16.2289


