Copyright
©2007 Baishideng Publishing Group Co.
World J Gastroenterol. Apr 21, 2007; 13(15): 2261-2262
Published online Apr 21, 2007. doi: 10.3748/wjg.v13.i15.2261
Published online Apr 21, 2007. doi: 10.3748/wjg.v13.i15.2261
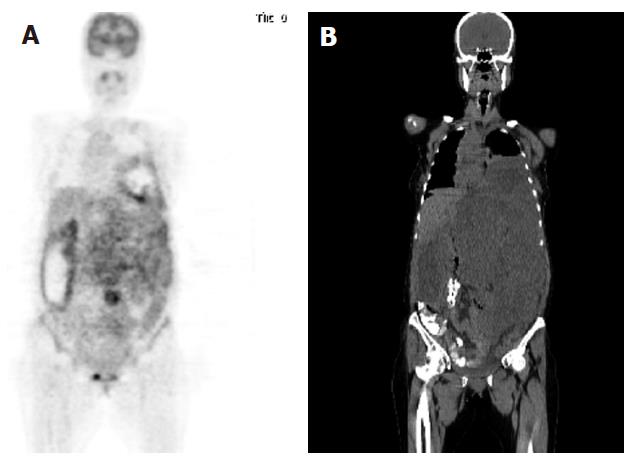
Figure 1 Coronal PET image demonstrating abnormal FDG uptake (A) and coronal CT image showing a large lesion occupying the same areas (B).
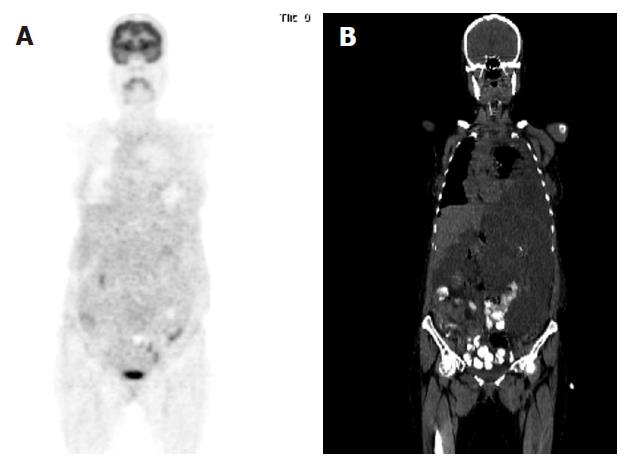
Figure 2 Coronal PET image demonstrating a significant metabolic response to imatinib treatment (A) and coronal CT image showing a large lesion (B).
There was no difference in dimensions before and after imatinib treatment although metabolic activity was inhibited.
- Citation: Zincirkeser S, Sevinc A, Kalender ME, Camci C. Early detection of response to imatinib therapy for gastrointestinal stromal tumor by using 18F-FDG-positron emission tomography and computed tomography imaging. World J Gastroenterol 2007; 13(15): 2261-2262
- URL: https://www.wjgnet.com/1007-9327/full/v13/i15/2261.htm
- DOI: https://dx.doi.org/10.3748/wjg.v13.i15.2261


