Copyright
©2007 Baishideng Publishing Group Co.
World J Gastroenterol. Apr 21, 2007; 13(15): 2198-2204
Published online Apr 21, 2007. doi: 10.3748/wjg.v13.i15.2198
Published online Apr 21, 2007. doi: 10.3748/wjg.v13.i15.2198
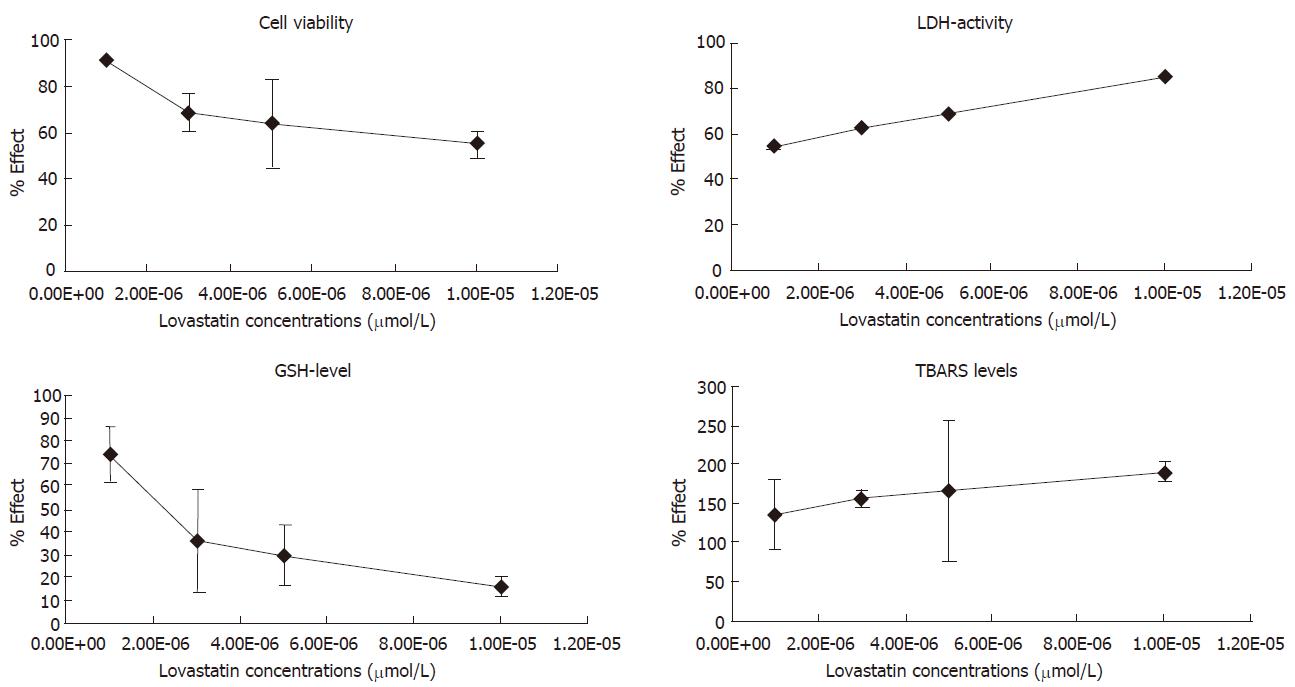
Figure 1 Changes in the examined parameters (%) after 1 h incubation with different concentrations of lovastatin.
The differences are expressed vs the control group.
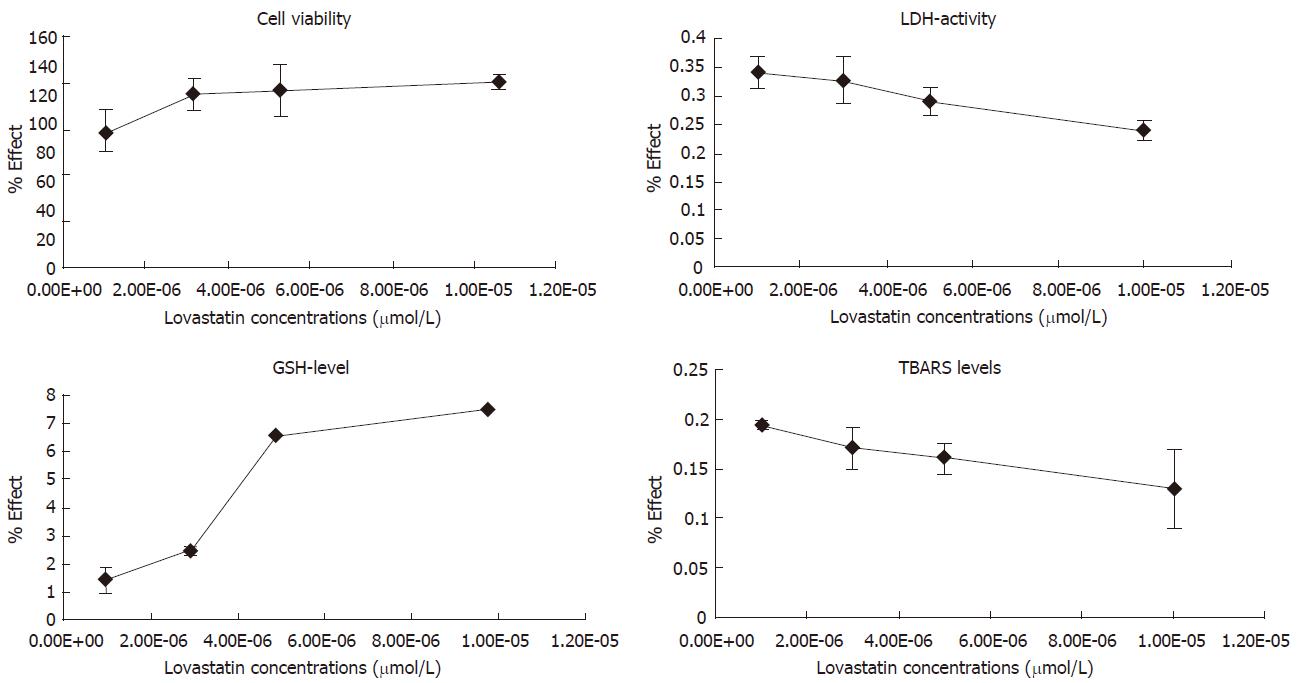
Figure 2 Changes in the examined parameters (%) after 1 h incubation with 86 μmol/L CCl4 and different concentrations of lovastatin.
The differences are expressed vs the CCl4 group.
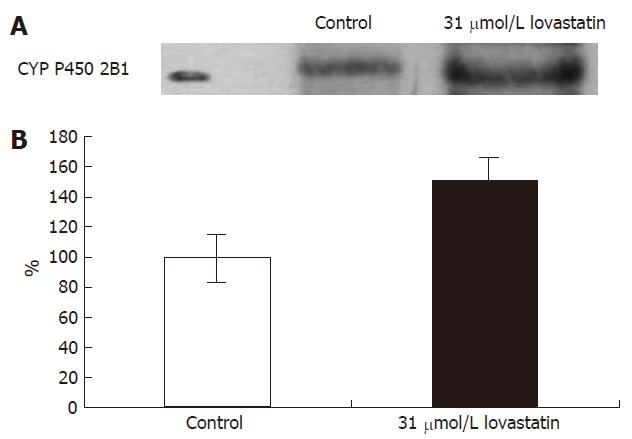
Figure 3 Effect of lovastatin on CYP 2B1 protein expression in cultured rat hepatocytes.
A: Western blot picture B: Expression of CYP2B1 (in %) Hepatocytes were incubated with 31 μmol/L lovastatin before western blotting analysis, as described in the methods part. Data are expressed as mean ± SD obtained from three independent experiments.
-
Citation: Krasteva A, Mitcheva M, Kondeva-Burdina M, Descatoire V.
In vitro study of lovastatin interactions with amiodarone and with carbon tetrachloride in isolated rat hepatocytes. World J Gastroenterol 2007; 13(15): 2198-2204 - URL: https://www.wjgnet.com/1007-9327/full/v13/i15/2198.htm
- DOI: https://dx.doi.org/10.3748/wjg.v13.i15.2198


