Copyright
©2007 Baishideng Publishing Group Co.
World J Gastroenterol. Apr 14, 2007; 13(14): 2061-2065
Published online Apr 14, 2007. doi: 10.3748/wjg.v13.i14.2061
Published online Apr 14, 2007. doi: 10.3748/wjg.v13.i14.2061
Figure 1 Schematic representation of the DMN treatment protocol.
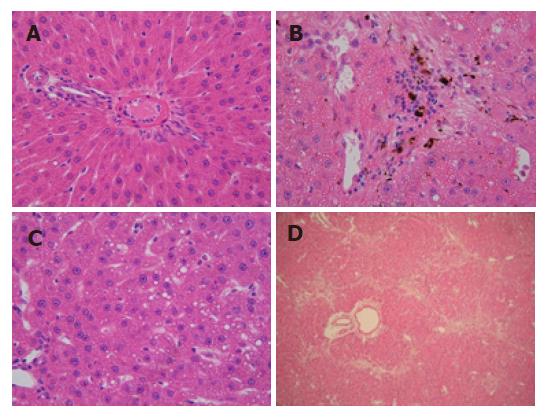
Figure 2 Liver histopathology of DMN-treated rats (HE).
A: Control group, no marked pathological changes (× 400); B: Group model A, hemorrhagic necrosis with foci of lymphomonocytic infiltration around fibrosis tissue can be seen (× 400); C: Group model B, fat accumulated in numerous liver cells (× 400); D: Group model B, quantities of fiber deposited and linked with each other (× 400).
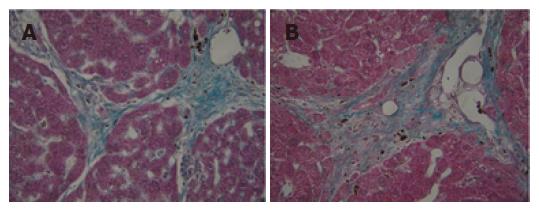
Figure 3 Rat liver fibrosis induced by DMN (Masson).
A: Group model A, the green fiber distributed between liver cells and accompanied with necrotic hemorrhage; B: Group model B, similar to group model A in fibrosis (× 400).
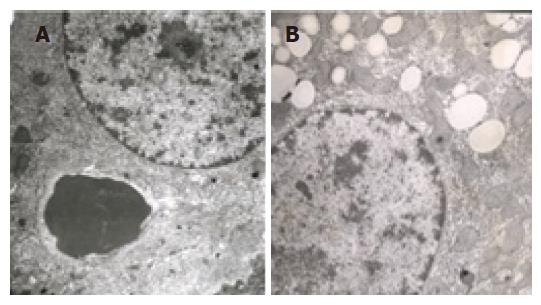
Figure 4 Ultrastructural changes of the liver in DMN-treated rats.
A: model group A, no marked lipid drops deposited in the liver cells and from which we also can see an erythrocyte pass through extracellular matrix and closely stick to the liver cell membrane; B: model group B, numerous lipid drops deposited in liver cell (electron microscopy, × 6000).
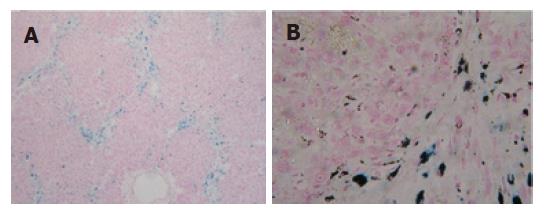
Figure 5 Iron deposition in rat liver induced by DMN (Prussian blue).
A: model group A, the iron is mainly accompanied by fiber (× 100); B: model group B, similar to the model A in iron deposition, iron nodules are deep blue in color and mainly located extracellularly or in the Kupffer cells (× 400).
- Citation: He JY, Ge WH, Chen Y. Iron deposition and fat accumulation in dimethylnitrosamine-induced liver fibrosis in rat. World J Gastroenterol 2007; 13(14): 2061-2065
- URL: https://www.wjgnet.com/1007-9327/full/v13/i14/2061.htm
- DOI: https://dx.doi.org/10.3748/wjg.v13.i14.2061


