Copyright
©2007 Baishideng Publishing Group Co.
World J Gastroenterol. Mar 21, 2007; 13(11): 1732-1736
Published online Mar 21, 2007. doi: 10.3748/wjg.v13.i11.1732
Published online Mar 21, 2007. doi: 10.3748/wjg.v13.i11.1732
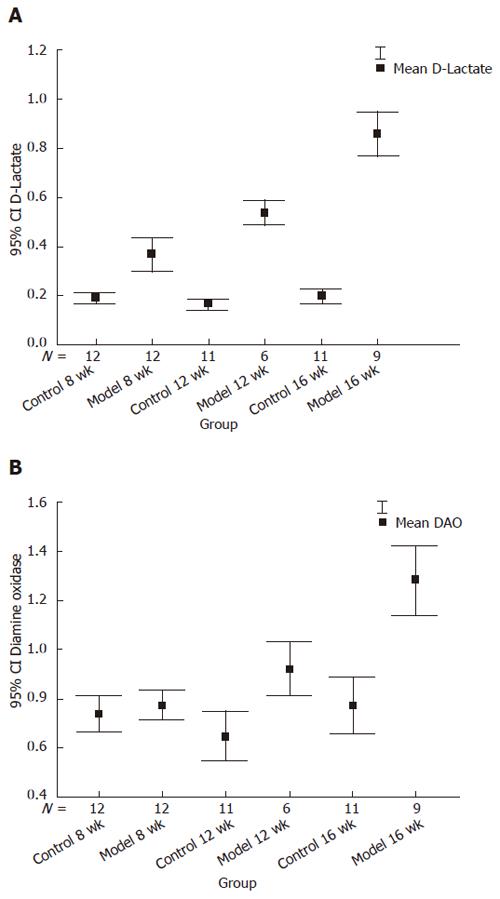
Figure 1 Level of D-lactate (A) and DAO (B) between the model and control groups at different time points.
Y axis represents the value of D-lactate and DAO with 95% confidence. A: Model at the 12th wk vs model at the 8th wk, t = 3.67, P = 0.002; model at the 16th wk vs model at the 12th wk, t = 6.29, P < 0.001; B: Model 12th wk vs model at the 8th wk, t = 3.13, P = 0.006; model at the 16th wk vs model at the 12th wk, t = 4.28, P = 0.001.
- Citation: Jin X, Yu CH, Lv GC, Li YM. Increased intestinal permeability in pathogenesis and progress of nonalcoholic steatohepatitis in rats. World J Gastroenterol 2007; 13(11): 1732-1736
- URL: https://www.wjgnet.com/1007-9327/full/v13/i11/1732.htm
- DOI: https://dx.doi.org/10.3748/wjg.v13.i11.1732


