Copyright
©2007 Baishideng Publishing Group Co.
World J Gastroenterol. Mar 21, 2007; 13(11): 1672-1679
Published online Mar 21, 2007. doi: 10.3748/wjg.v13.i11.1672
Published online Mar 21, 2007. doi: 10.3748/wjg.v13.i11.1672
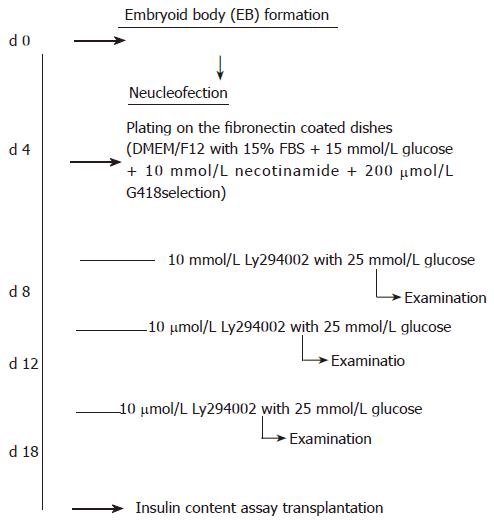
Figure 1 Flow chart of experiments.
Culture medium was changed with glucose (25 mmol/L) and LY294002 (10 μv) supplement 24 h before examination and 8, 12 and 18 d after experiment.
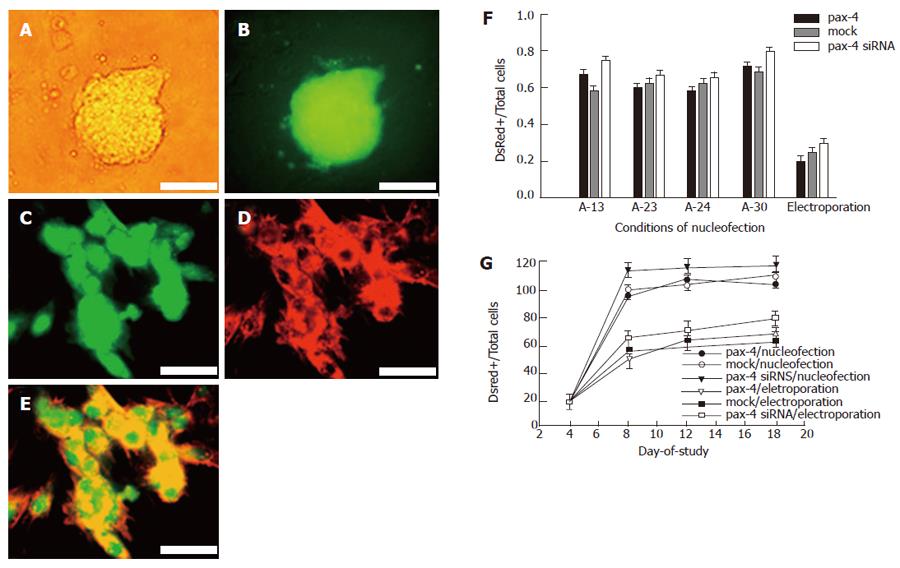
Figure 2 Nucleofection of EB-dissociated cells.
A: EB-dissociated cells after four days by hanging drop; B: eGFP fluorescent view (Bar= 50 μm in A, B); C: Morphology of EB-dissociated cells 56 h after nucleofection; D: eGFP filter view; E: DsRed view and the merge image (Bar = 5 μm in C-E); F: Efficiency of gene delivery; G: Latency of gene examination in ES cells after nucleofection. The ratio of DsRed-expressed cells was counted by random photograph 8, 12 and 18 d after experiment.
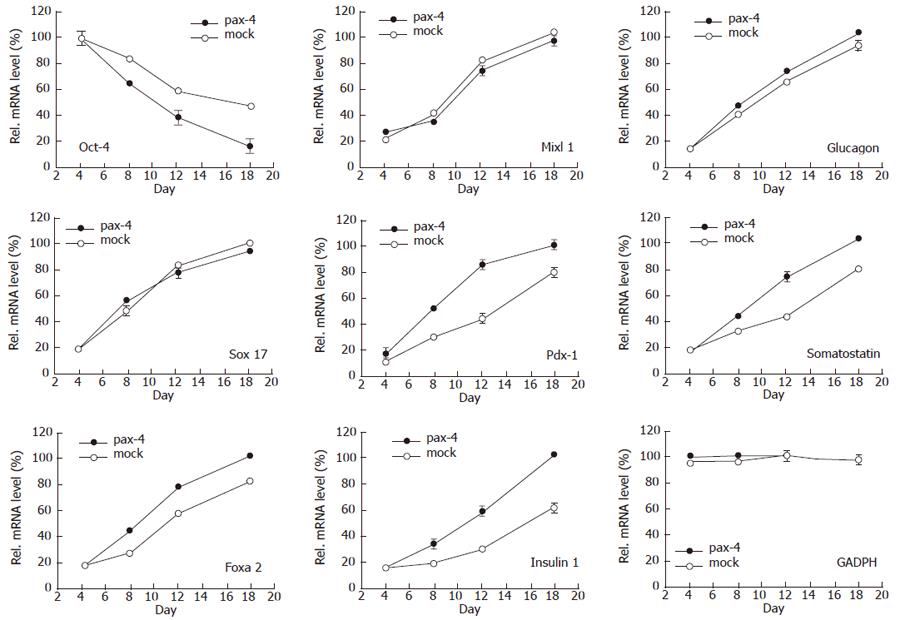
Figure 3 Relative mRNA level of relative gene expression 4 (before nucleofection), 8, 12 and 18 d after experiment.
The highest expression was 100%. Genes such as oct-4, sox-17, foxa 2, mixl 1, pdx-1, insulin 1, glucagons, somatostatin and GADPH were detected.
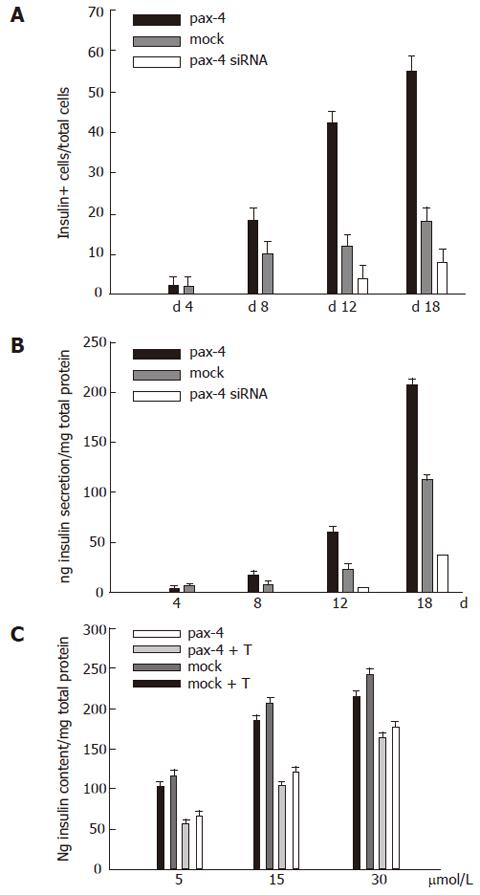
Figure 4 Efficiency of IPC formation.
A: Ratio of DsRed- expressed cells 4 (before nucleofection), 8, 12 and 18 d after experiment in the groups of cells with pax-4, mock and pax-4 siRNA plasmid; B: Insulin secretion in medium detected by ELISA; C: Insulin content in cells after 24 h incubation with different concentrations of glucose (5 mmol/L, 15 mmol/L or 30 mmol/L) and with/without 10 μmol/L Tolbutamide treatment (T).
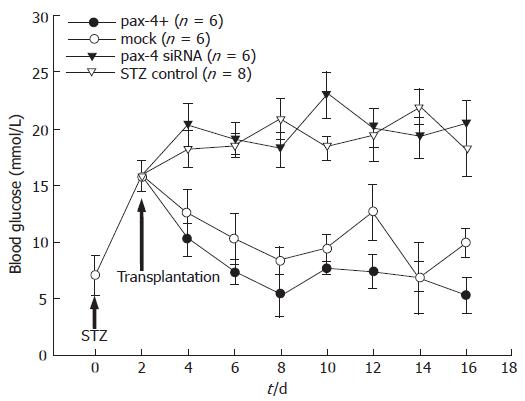
Figure 5 Normal normoglycemia restoration in STZ- pretreated SCID mice after cell transplantation.
The concentration of blood glucose was monitored every two days.
- Citation: Lin HT, Kao CL, Lee KH, Chang YL, Chiou SH, Tsai FT, Tsai TH, Sheu DC, Ho LL, Ku HH. Enhancement of insulin-producing cell differentiation from embryonic stem cells using pax4-nucleofection method. World J Gastroenterol 2007; 13(11): 1672-1679
- URL: https://www.wjgnet.com/1007-9327/full/v13/i11/1672.htm
- DOI: https://dx.doi.org/10.3748/wjg.v13.i11.1672


