Copyright
©2006 Baishideng Publishing Group Co.
World J Gastroenterol. Feb 28, 2006; 12(8): 1192-1197
Published online Feb 28, 2006. doi: 10.3748/wjg.v12.i8.1192
Published online Feb 28, 2006. doi: 10.3748/wjg.v12.i8.1192
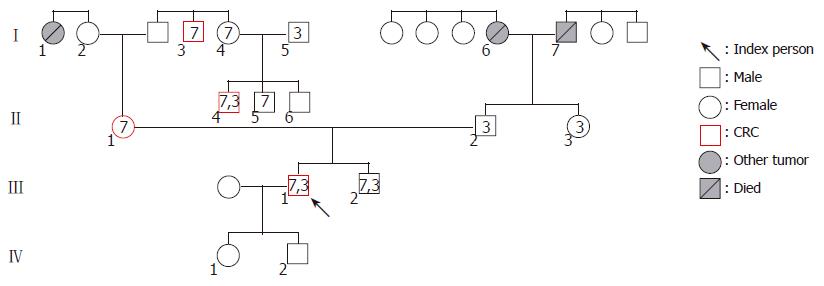
Figure 1 Pedigree of the index person.
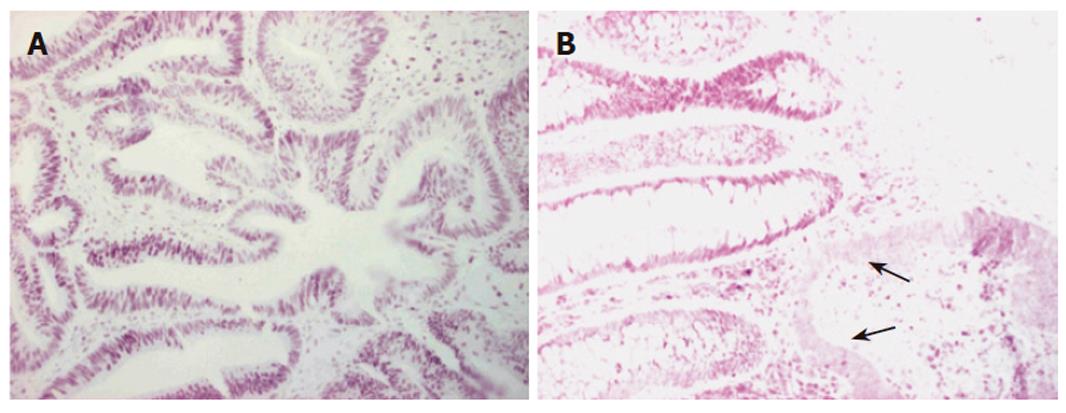
Figure 2 Immunostaining for hMLH1 and hMSH2.
Nuclei of tumor and normal colon mucosa cells show reactivity for hMLH1 (left), whereas hMSH2 staining is missing from the tumor cells (right, arrows). LSAB, original magnification, x200.
Figure 3 LightCycler Tm estimation of Bat26 (A) and Bat25 (B) microsatellite markers.
Dotted lines represent MSS control. Tm is 51°C for Bat26 and 46°C for Bat25. The solid lines show decreased Tm values corresponding to the MSI-H status of tumor tissue. Tm is 44.6°C for Bat26 and 40.5°C for Bat25 respectively.
- Citation: Tanyi M, Olasz J, Lukács G, Csuka O, Tóth L, Szentirmay Z, Ress Z, Barta Z, Tanyi JL, Damjanovich L. Pedigree and genetic analysis of a novel mutation carrier patient suffering from hereditary nonpolyposis colorectal cancer. World J Gastroenterol 2006; 12(8): 1192-1197
- URL: https://www.wjgnet.com/1007-9327/full/v12/i8/1192.htm
- DOI: https://dx.doi.org/10.3748/wjg.v12.i8.1192


