Copyright
©2006 Baishideng Publishing Group Co.
World J Gastroenterol. Feb 21, 2006; 12(7): 1110-1114
Published online Feb 21, 2006. doi: 10.3748/wjg.v12.i7.1110
Published online Feb 21, 2006. doi: 10.3748/wjg.v12.i7.1110
Figure 1 Effect of PS on pancreatic weight/body weight ratio (pw/bw) in CCK octapeptide-induced AP.
Data are expressed as mean ± SE for 6 animals per group. P < 0.05 vs control group.
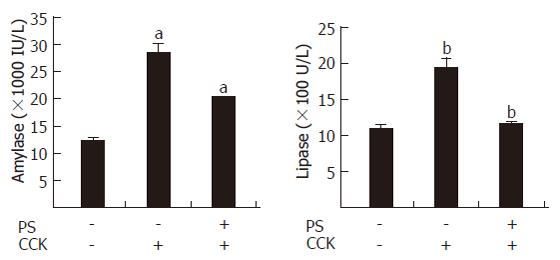
Figure 2 PS inhibition of serum amylase and lipase levels in CCK octapeptide-induced AP in rats.
Values are expressed as mean ± SE for at least 6 animals per group. P < 0.05 vs control group.
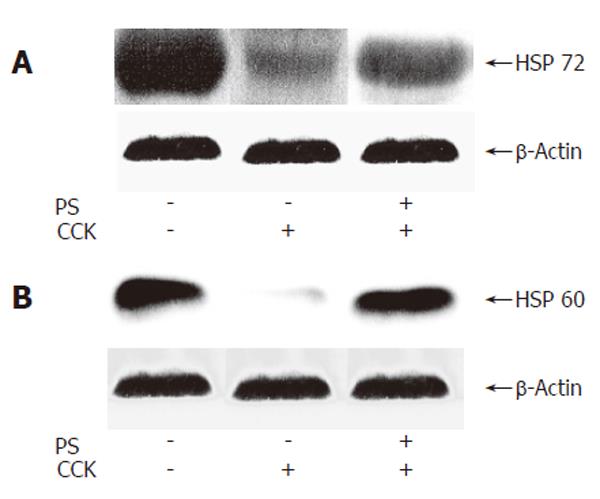
Figure 3 Western blot analysis of effect of PS on HSP60 and HSP72 expressions in CCK octapeptide-induced AP.
A: HSP60; B: HSP72.
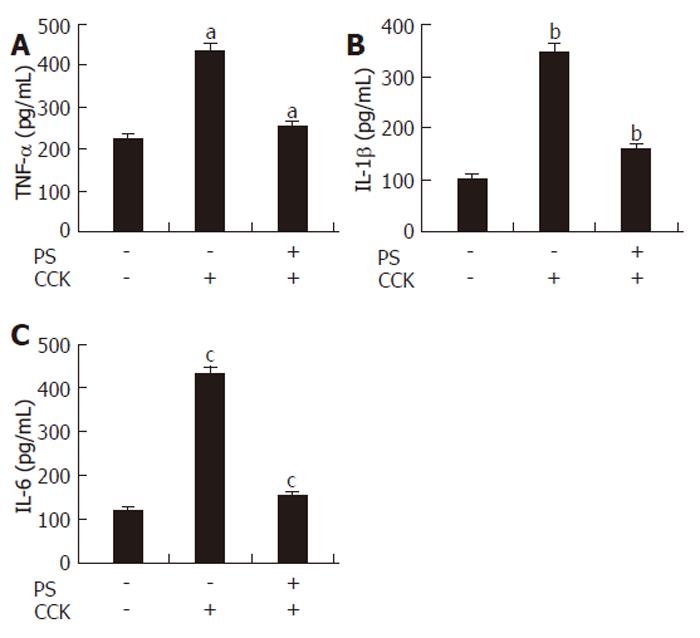
Figure 4 Effect of PS on TNF-α, IL-1β and IL-6 secretion in CCK octapeptide-induced AP.
Data are expressed as mean ± SE for 6 animals in each group. P < 0.05 vs control group.
- Citation: Seo SW, Park CS, Hong SH, Kwon KB, Moon HC, Song BK, Kim KY, Park YM, Song HJ, Kim HM, Park SJ. Inhibitory effect of Patrinia scabiosaefolia on acute pancreatitis. World J Gastroenterol 2006; 12(7): 1110-1114
- URL: https://www.wjgnet.com/1007-9327/full/v12/i7/1110.htm
- DOI: https://dx.doi.org/10.3748/wjg.v12.i7.1110


