Copyright
©2006 Baishideng Publishing Group Co.
World J Gastroenterol. Feb 21, 2006; 12(7): 1078-1085
Published online Feb 21, 2006. doi: 10.3748/wjg.v12.i7.1078
Published online Feb 21, 2006. doi: 10.3748/wjg.v12.i7.1078
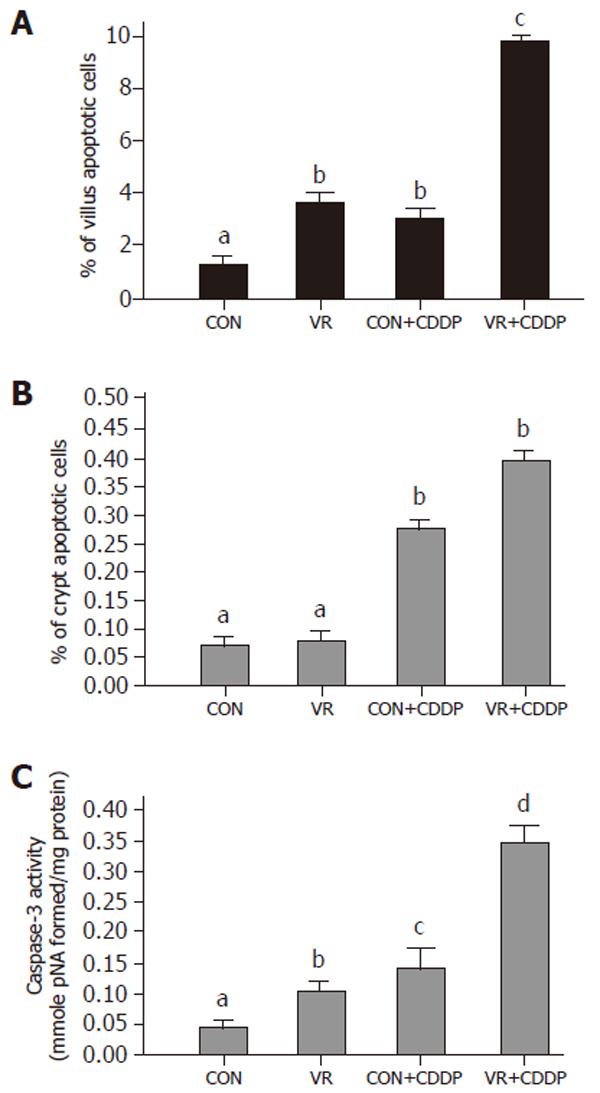
Figure 1 Apoptotic index and caspase-3 activity of the intestinal mucosa of control and vitamin restricted rats treated with cisplatin or saline (vehicle).
Vertical bars are means with standard error, of IEC apoptotic indices in villus (Panel A) and crypt (Panel B) regions of control, vitamin restricted rats treated with saline and cisplatin (n = 6 per group). Intestinal sections were stained with hematoxylin and eosin and studied by morphometry under a light microscope. Caspase-3 activity (Panel C) was measured in 12000 g supernatant using a colorimetric substrate.
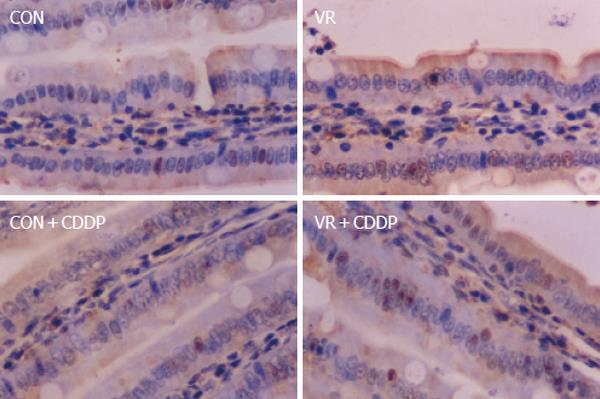
Figure 2 Photomicrographs of apoptotic cells showing positivity for M30 antibody.
Representative photomicrographs of intestinal sections immuno-histochemically stained with M 30 antibody. De-paraffinized, intestinal sections were hydrated and probed with M 30 antibody and the positive cells detected by enzymatic color reaction. Number of the brown colored positive cells were counted in a total of 1000 cells and expressed as the percentage.
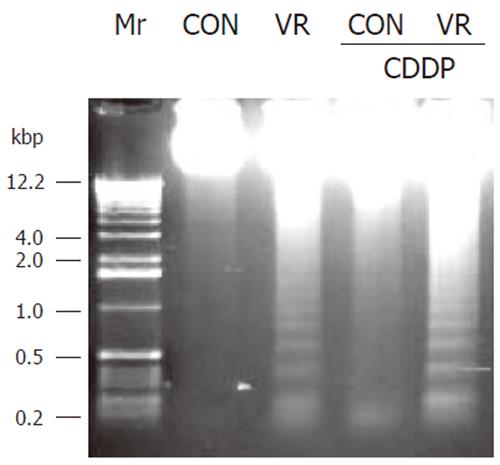
Figure 3 DNA fragmentation pattern in intestinal epithelial cells of control and vitamin restricted treated with saline or cisplatin.
Epithelial cells were separated from a portion of rat jejunum, DNA extracted and resolved on a 1.5% agarose gel and stained with ethidium bromide.
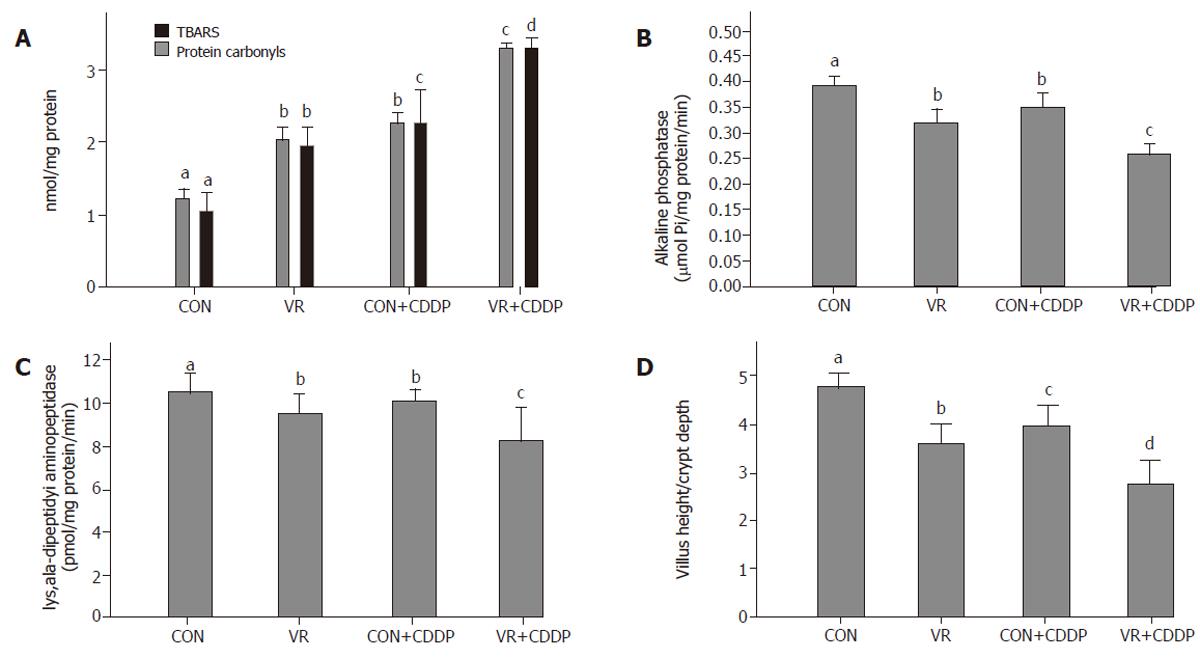
Figure 4 Effect of vitamin restriction and cisplatin on oxidative stress, structural and functional integrity of the intestinal mucosa.
Levels of lipid peroxides (TBARS) and protein carbonyls are shown in panel A. Lowered activities of alkaline phosphatase (Panel B), lys, ala-dipeptidyl aminopeptidase (Panel C), are indicative of compromised functional integrity. Panel D indicates the ratio of villus height: crypt depth in control and vitamin restricted rats treated with saline and cisplatin, indicating structural integrity of the mucosa.
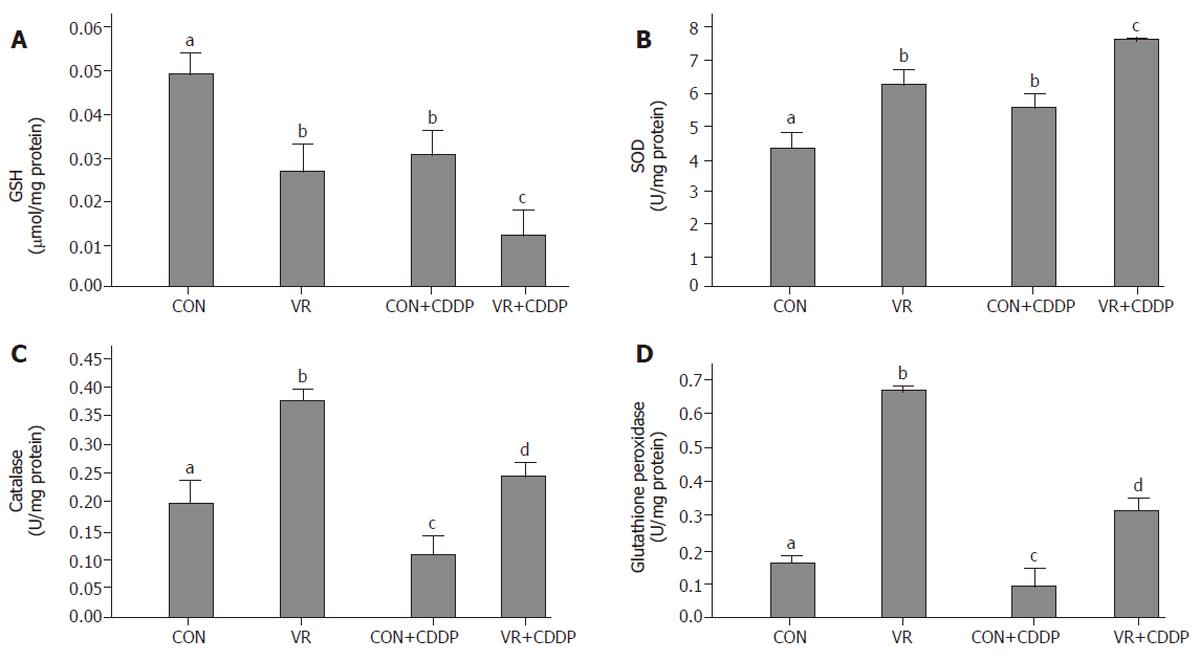
Figure 5 Intestinal glutathione levels and antioxidant enzyme activities in control and vitamin restricted rats treated with saline or cisplatin.
Glutathione (GSH) levels are shown in panel A, whereas activities of SOD, catalase and glutathione peroxidase (GPX) are shown in panels B to D, respectively.
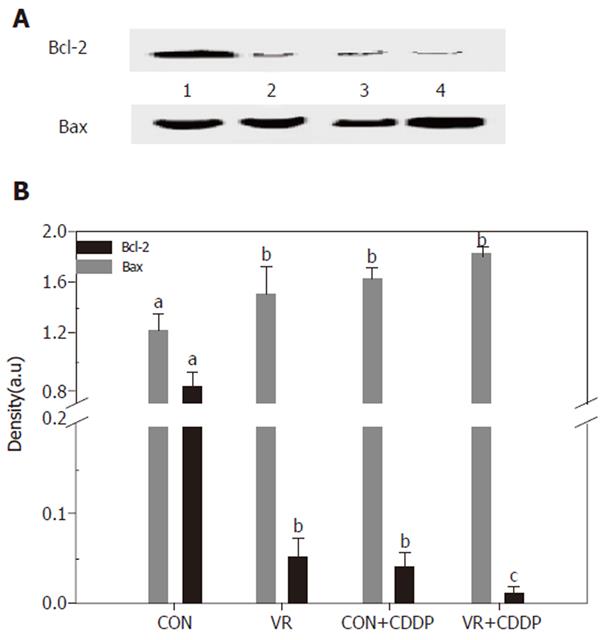
Figure 6 Expression of apoptosis regulatory proteins (Bcl-2 and Bax) in the intestinal epithelial cells Bcl-2 and Bax were immune-precipitated from the 12,000 g supernatant of the intestinal mucosal scrapings using monoclonal Bcl-2 / Bax antibodies.
The immuno-precipitates were resolved on 12% SDS-PAGE, transferred electrophoretically to PVDF membrane and the immuno-blots developed using the same antibodies and detected / quantified with HRP conjugated anti - rabbit antibodies. Lane 1 - 4 are: CON, VR, CON+CDDP, VR+CDDP respectively. Upper panel shows Bcl-2 expression and bottom panel shows Bax expression. Panel B: Quantification of the IP / Western blots of Bcl-2 and Bax proteins. Immuno-blot was scanned using a densitometer (BioRad) and densities quantified using the Quantity One software from BioRad. Each bar represents the mean ± SE of three immuno-blots. Bars with different superscripts are significantly different from one another (P≤ 0.05) by one-way ANOVA and post-hoc least significant difference test.
- Citation: Vijayalakshmi B, Sesikeran B, Udaykumar P, Kalyanasundaram S, Raghunath M. Chronic low vitamin intake potentiates cisplatin-induced intestinal epithelial cell apoptosis in WNIN rats. World J Gastroenterol 2006; 12(7): 1078-1085
- URL: https://www.wjgnet.com/1007-9327/full/v12/i7/1078.htm
- DOI: https://dx.doi.org/10.3748/wjg.v12.i7.1078


