Copyright
©2006 Baishideng Publishing Group Co.
World J Gastroenterol. Feb 21, 2006; 12(7): 1025-1032
Published online Feb 21, 2006. doi: 10.3748/wjg.v12.i7.1025
Published online Feb 21, 2006. doi: 10.3748/wjg.v12.i7.1025
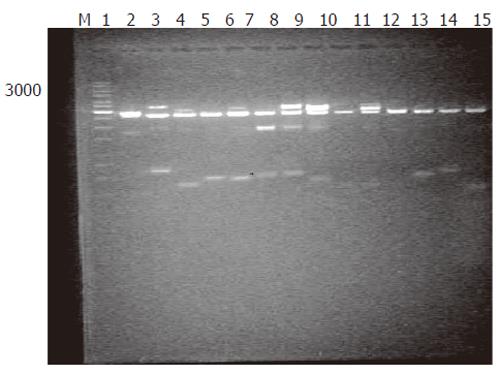
Figure 1 Digestion plasmids of EcoRI/Hind/II.
Lane M: DNA size markers; 1-15 lanes: Fragment of about 500 bp after EcoRI/HindIII digestion.
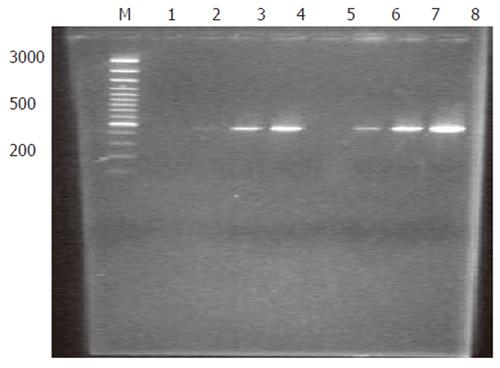
Figure 2 Reduction of G3PDH after PCR-select subtraction.
M: DNA size markers; 1-4 lanes: Subtracted PCR products as template, G3PDH3’ and 5’ as primers at cycles 18, 23, 28, 33; 5-8 lanes: PCR products not subtracted as template, G3PDH3’ and 5’ as primers at cycles 18, 23, 28, 33.
Figure 3 Increased c-myc after PCR-select subtraction.
M: DNA size markers; 1-4 lanes (left): PCR products not subtracted as template, c-myc 3’ and 5’ as primers at cycles 18, 23, 28, 33; 5-8 lanes: No PCR products subtracted as template, c-myc 3’ and 5’ as primers at cycles 18, 23, 28, 33; 1-4 lanes (right): PCR products subtracted as template, c-myc 3’ and 5’ as primers at cycles 18, 23, 28, 33.
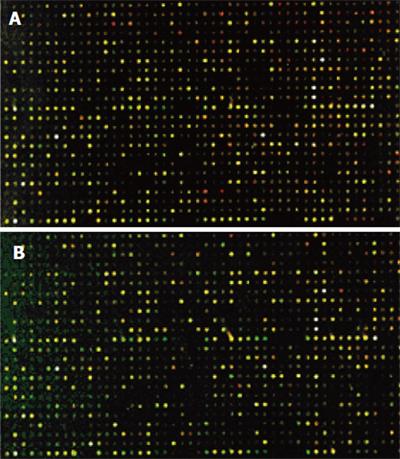
Figure 4 cDNA microarray hybridized with fluorescent labeled probes prepared from HCRAC (A) and total RNA from normal colorectal tissue (B).
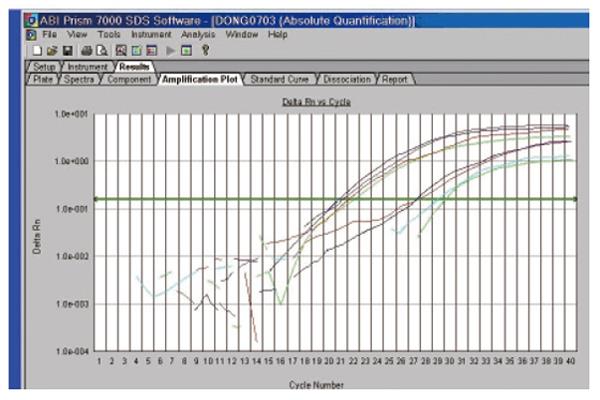
Figure 5 Results of QRT-PCR.
Blue/brown/:β-actin N/β-actinT; green/bright green: CaMT/CaMN; green/red: Hsp10T/Hsp10N; blue: Sox-9N/Sox-9T.
- Citation: Chen Y, Zhang YZ, Zhou ZG, Wang G, Yi ZN. Identification of differently expressed genes in human colorectal adenocarcinoma. World J Gastroenterol 2006; 12(7): 1025-1032
- URL: https://www.wjgnet.com/1007-9327/full/v12/i7/1025.htm
- DOI: https://dx.doi.org/10.3748/wjg.v12.i7.1025


