Copyright
©2006 Baishideng Publishing Group Co.
World J Gastroenterol. Feb 14, 2006; 12(6): 966-970
Published online Feb 14, 2006. doi: 10.3748/wjg.v12.i6.966
Published online Feb 14, 2006. doi: 10.3748/wjg.v12.i6.966
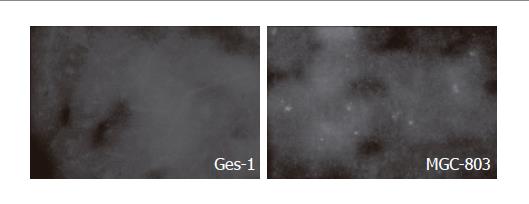
Figure 1 Expression of E-cadherin in SV40-immortalized Ges-1 and gastric cancer cell lines.
Negative staining of E-cadherin in Ges-1 and MGC-803 was shown on immunofluorescent micrographs.
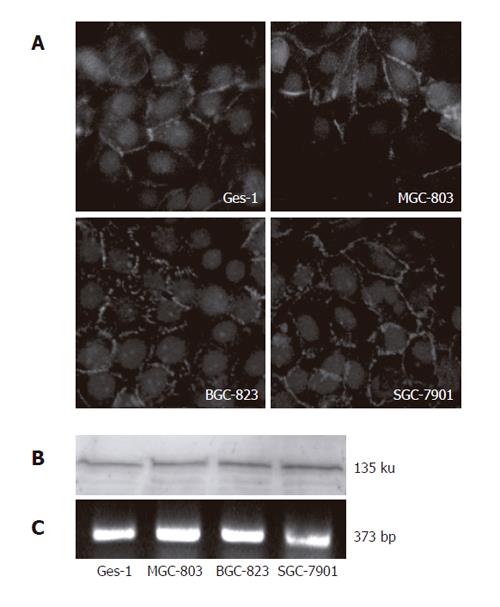
Figure 2 Expression of N-cadherin in SV40-immortalized Ges-1 and gastric cancer cell lines.
A: Distribution of N-cadherin fluorescence on cell membranes in Ges-1 and gastric cancer cell lines; B: A band of 135 ku N-cadherin protein detected by Western blotting of N-cadherin; C: N-cadherin mRNA expression shown by RT-PCR.
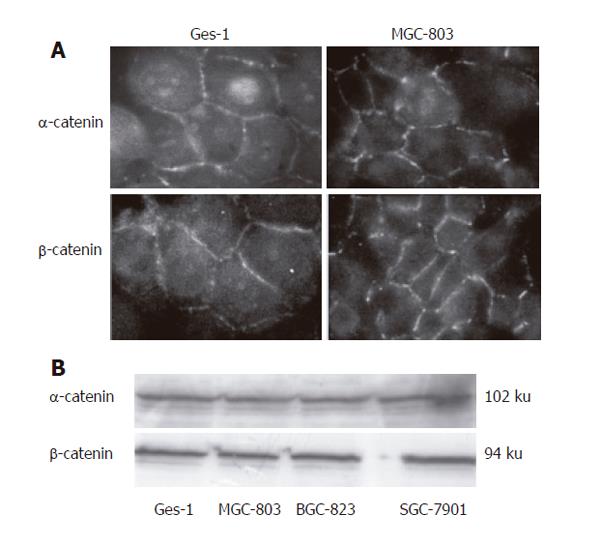
Figure 3 Expression of α- and β-catenins in Ges-1 and gastric cancer cell lines.
A: Distribution of α- and β-catenin fluorescence on cell membranes and cell-cell borders in Ges-1 and MGC-803; B: Reactive bands at 102 ku and 94 ku of α- and β-catenins in Ges-1 and cancer cell lines.
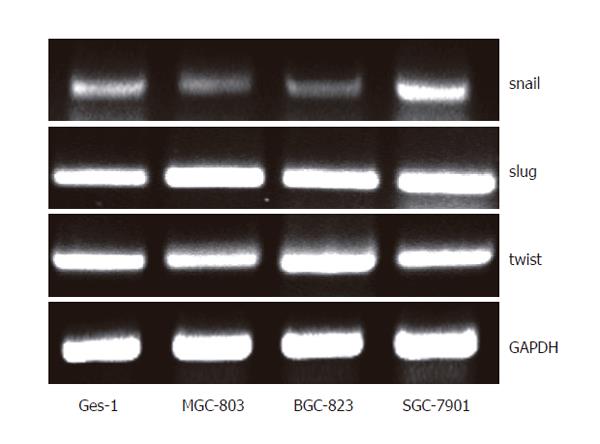
Figure 4 Expression of E-cadherin transcription repressors (snail, slug) and N-cadherin activator (twist) in Ges-1 and gastric cancer cell lines.
- Citation: Wang BJ, Zhang ZQ, Ke Y. Conversion of cadherin isoforms in cultured human gastric carcinoma cells. World J Gastroenterol 2006; 12(6): 966-970
- URL: https://www.wjgnet.com/1007-9327/full/v12/i6/966.htm
- DOI: https://dx.doi.org/10.3748/wjg.v12.i6.966


