Copyright
©2006 Baishideng Publishing Group Co.
World J Gastroenterol. Feb 14, 2006; 12(6): 956-960
Published online Feb 14, 2006. doi: 10.3748/wjg.v12.i6.956
Published online Feb 14, 2006. doi: 10.3748/wjg.v12.i6.956
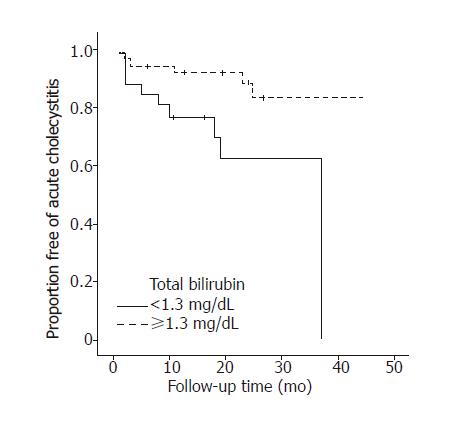
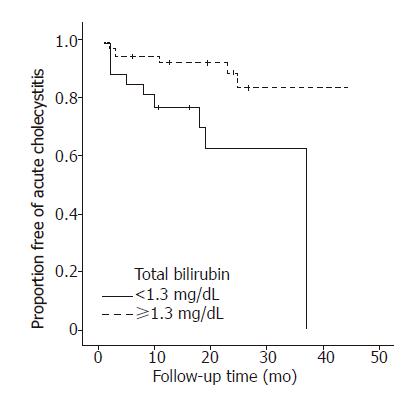
Figure 1 Kaplan–Meier’s curve comparing two total bilirubin levels in relation to the development of acute cholecystitis.
Patients with a total bilirubin of < 1.3 mg/dL developed acute cholecystitis more frequently than patients with a level of ≥1.3 mg/dL (P = 0.01, log-rank test).
Figure 2 Kaplan–Meier’s curve comparing two CBD diameters in relation to acute cholecystitis development.
Patients with CBD diameters <11 mm developed acute cholecystitis more frequently than patients with CBD diameters of ≥11 mm (P = 0.03, log-rank test).
- Citation: Lee JK, Ryu JK, Park JK, Yoon WJ, Lee SH, Lee KH, Kim YT, Yoon YB. Risk factors of acute cholecystitis after endoscopic common bile duct stone removal. World J Gastroenterol 2006; 12(6): 956-960
- URL: https://www.wjgnet.com/1007-9327/full/v12/i6/956.htm
- DOI: https://dx.doi.org/10.3748/wjg.v12.i6.956


