Copyright
©2006 Baishideng Publishing Group Co.
World J Gastroenterol. Feb 7, 2006; 12(5): 760-764
Published online Feb 7, 2006. doi: 10.3748/wjg.v12.i5.760
Published online Feb 7, 2006. doi: 10.3748/wjg.v12.i5.760
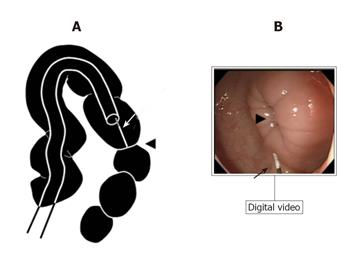
Figure 1 Illustration of the procedure (A) and actual endoscopic image (B).
A distance of about 10 mm was kept between the spastic region (arrow head) and the tip of the colonoscope. The distance was objectively measured using a wire (arrow) which was inserted through the working channel.
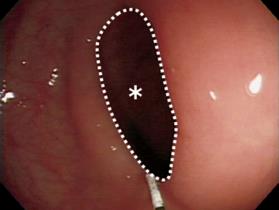
Figure 2 The white broken line demarcates the intraluminal spastic region and the area of the region was measured using a computer image analyzer (*).
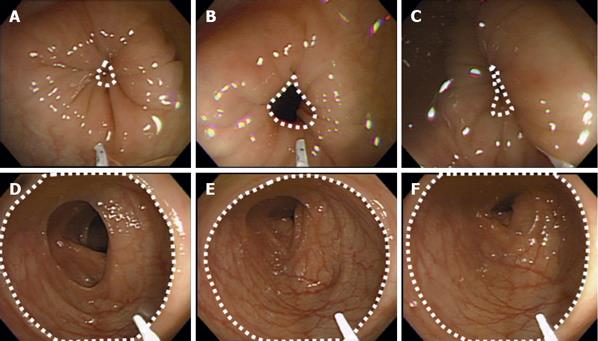
Figure 3 Endoscopic view in the TJ-68 group.
Serial endoscopic views of the spastic region at the sigmoid colon before and after spraying of the TJ-68 solution are shown (A-F). The white broken line demarcates the area of the spastic region. The spastic region started to relax 0.5 min after spraying of the TJ-68 solution and remained open for 3 min.
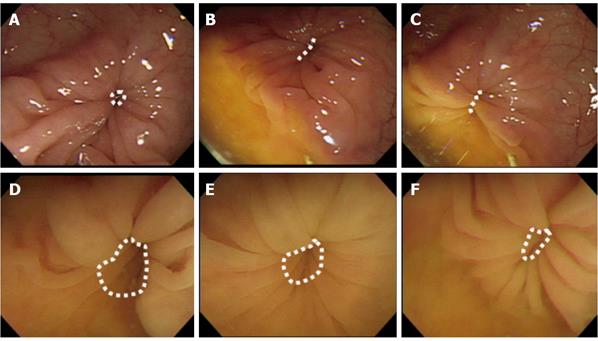
Figure 4 Endoscopic view in the normal saline group.
Serial endoscopic views of the spastic region at the sigmoid colon before and after spraying of normal saline are shown (A-F). The white broken line demarcates the area of the spastic region. The region showed only little relaxation and did not open significantly during the study.
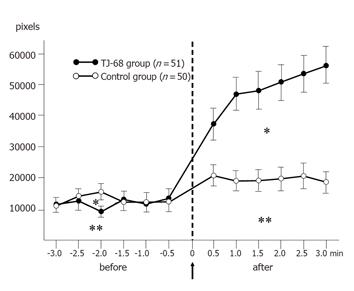
Figure 5 Pixel curve and area under the curve (AUC) before and after the administration of the TJ-68 solution and normal saline.
The graph shows the mean AUC of the two groups before and after spraying of TJ-68 (*) and normal saline (**): the mean AUC in the TJ-68 group increased significantly from 29 127 to 121 942 pixels, but the control group did not show a significant increase.
- Citation: Ai M, Yamaguchi T, Odaka T, Mitsuhashi K, Shishido T, Yan J, Seza A, Saisho H. Objective assessment of the antispasmodic effect of Shakuyaku-kanzo-to (TJ-68), a Chinese herbal medicine, on the colonic wall by direct spraying during colonoscopy. World J Gastroenterol 2006; 12(5): 760-764
- URL: https://www.wjgnet.com/1007-9327/full/v12/i5/760.htm
- DOI: https://dx.doi.org/10.3748/wjg.v12.i5.760


