Copyright
©2006 Baishideng Publishing Group Co.
World J Gastroenterol. Dec 14, 2006; 12(46): 7514-7521
Published online Dec 14, 2006. doi: 10.3748/wjg.v12.i46.7514
Published online Dec 14, 2006. doi: 10.3748/wjg.v12.i46.7514
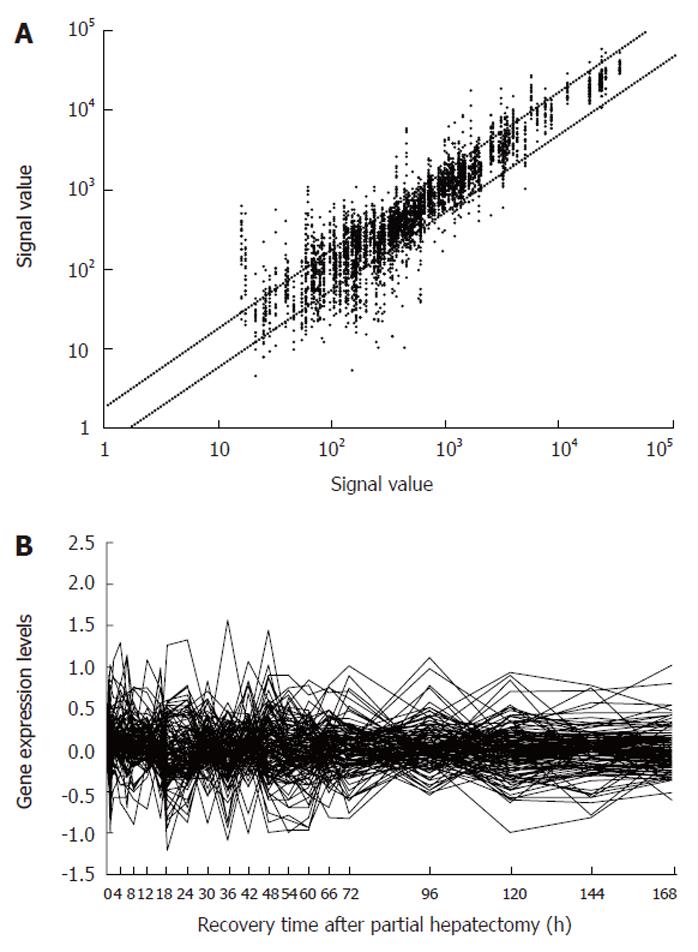
Figure 1 Expression frequency (A) and changes (B) of 127 cellular immune response-associated genes during rat liver regeneration.
Detection data of rat genome 230 2.0 array were analyzed and graphed by Microsoft Excel. The dots above bias represent the expression of genes up-regulated more than two fold, those under bias represent down-regulated more than two fold; the total times of up-regulated, down-regulated expression under bias are 419, 274, respectively. The ones between biases have meaningless alteration.The expression of 88 genes is up-regulated 2-37 fold and that of 86 genes is down-regulated 2-10 fold.
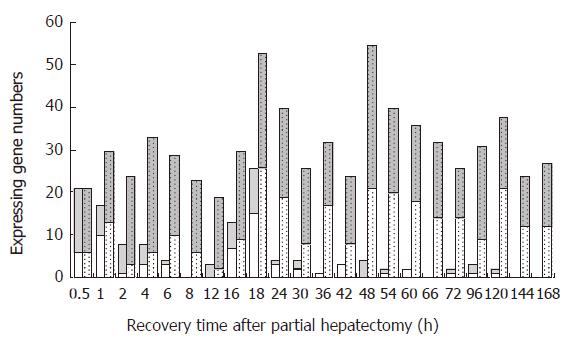
Figure 2 Initial and total expression profiles of 127 cellular immune response-associated genes at each time point of liver regeneration.
Grey bars: up-regulated genes; white bars: down-regulated genes; blank bars: initial expressing genes in which up-regulated genes are predominant in the forepart and prophase and down-regulated genes in the metaphase, whereas very few genes in the anaphase; dotted bars: total expressing genes in which some genes are up-regulated and others are down-regulated during the whole LR.
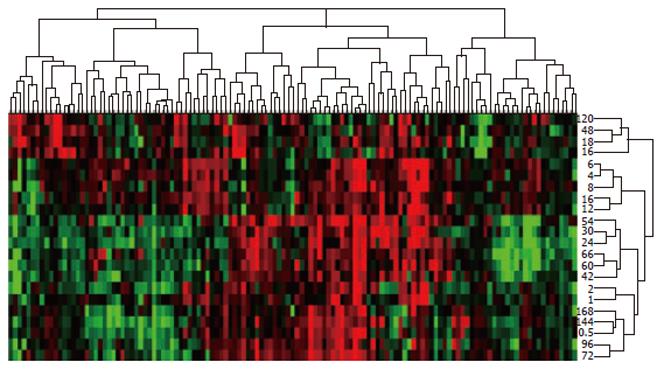
Figure 3 Expression similarity and time relevance clusters of 127 cellular immune response-associated genes during liver regeneration.
Detection data of rat genome 230 2.0 array were analyzed by H-clustering. Red represents up-regulated genes chiefly associated with antigen processing and presentation; green represents down-regulated genes mainly associated with antigen elimination; black represents the genes whose expressions are meaningless. The upper and right trees showing the expression similarity cluster and time series cluster respectively, by which these genes can be classified into 5 and 14 groups, respectively.
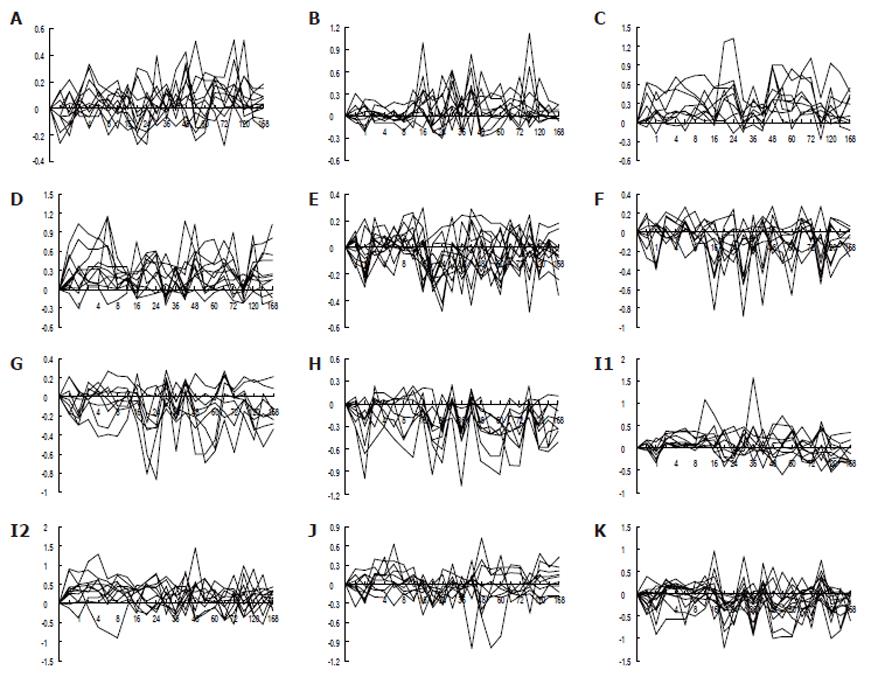
Figure 4 Twenty-one gene expression patterns of 127 cellular immune response-associated genes during liver regeneration.
Expression patterns were obtained by analysis of detection data with rat genome 230 2.0 array using Microsoft Excel. A-D: 41 up-regulated genes; E-H: 41 down-regulated genes; I-K: 45 up/down-regulated genes. X-axis represents recovery time after PH (h); Y-axis shows logarithm ratio of the signal values of genes at each time point to control.
- Citation: Zhang LX, Zhao LF, Zhang AS, Chen XG, Xu CS. Expression patterns and action analysis of genes associated with physiological responses during rat liver regeneration: Cellular immune response. World J Gastroenterol 2006; 12(46): 7514-7521
- URL: https://www.wjgnet.com/1007-9327/full/v12/i46/7514.htm
- DOI: https://dx.doi.org/10.3748/wjg.v12.i46.7514


