Copyright
©2006 Baishideng Publishing Group Co.
World J Gastroenterol. Dec 14, 2006; 12(46): 7508-7513
Published online Dec 14, 2006. doi: 10.3748/wjg.v12.i46.7508
Published online Dec 14, 2006. doi: 10.3748/wjg.v12.i46.7508
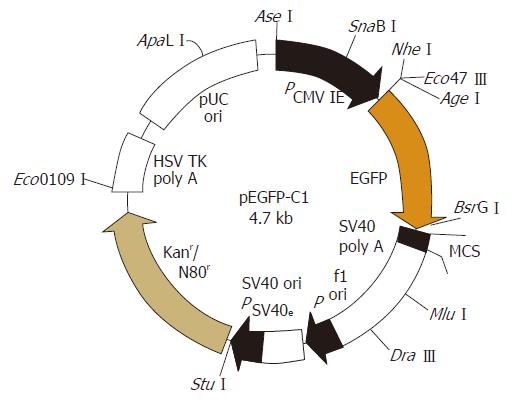
Figure 1 Map of pEGFP-C1, showing the restriction sites.
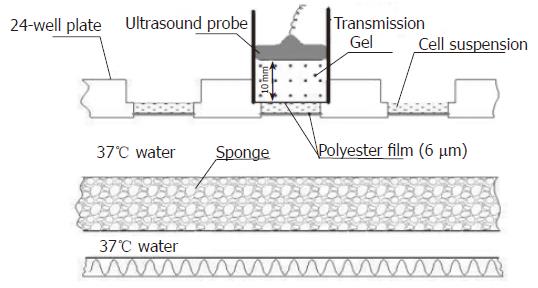
Figure 2 Experimental setup for the ultrasound exposure.
Ultrasound probe with transmission gel was placed on the cell suspension covered with polyester film, a 24-well plate covered by a 6-μm polyester film was kept in a water bath at 37°C, and also a sponge mat was placed in the water bath.
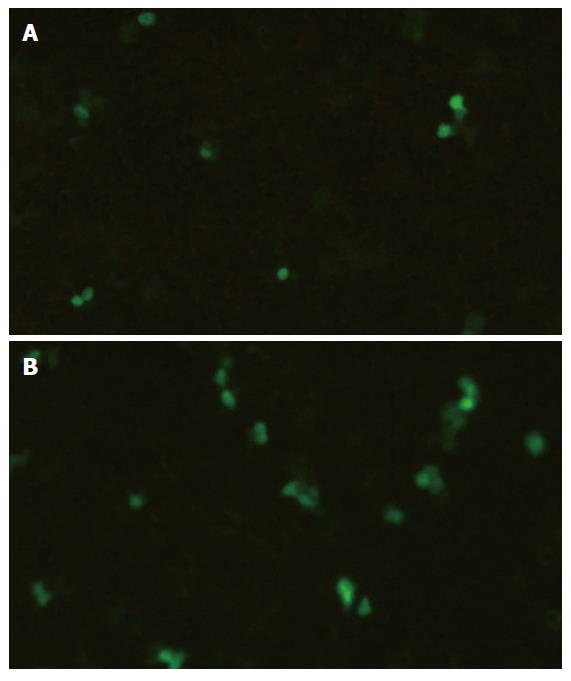
Figure 3 Fluorescent microscopy showing FD500-positive HUVECs (200 ×).
(A) A few FD500-positive HUVECs with ultrasound only; (B) significant increase in FD500-positive HUVECs after the addition of SonoVue.
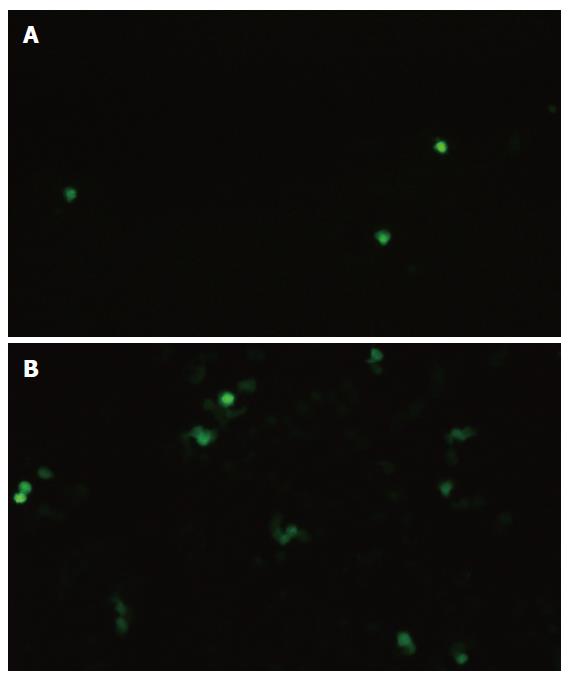
Figure 4 Fluorescent microscopy after EGFP gene transfection (200 ×).
(A) EGFP expression 48 h after ultrasound exposure only; (B) significant increase in EGFP expression in HUVECs 48 h after the addition of SonoVue.
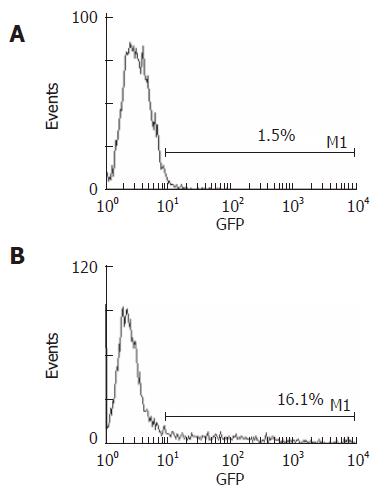
Figure 5 Detection of EGFP gene transfection by flow cytometry.
(A) Cells exposed to ultrasound only showed 1.5% of HUVECs within M1 area; (B) cells exposed to both the ultrasound and SonoVue showed 16.1% of HUVECs within M1 area.
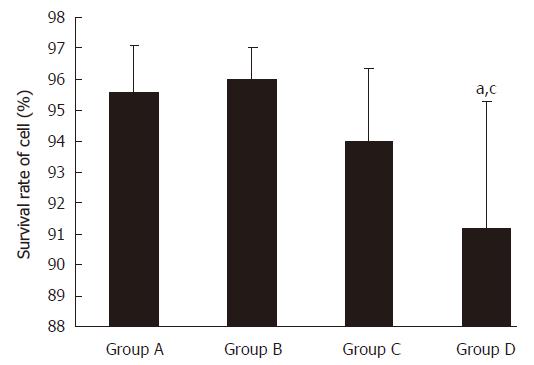
Figure 6 HUVECs survival rate 48 h after gene transfection.
aP < 0.05 vs group A and B ; cP > 0.05 vs group C.
- Citation: Nie F, Xu HX, Tang Q, Lu MD. Microbubble-enhanced ultrasound exposure improves gene transfer in vascular endothelial cells. World J Gastroenterol 2006; 12(46): 7508-7513
- URL: https://www.wjgnet.com/1007-9327/full/v12/i46/7508.htm
- DOI: https://dx.doi.org/10.3748/wjg.v12.i46.7508


