Copyright
©2006 Baishideng Publishing Group Co.
World J Gastroenterol. Dec 14, 2006; 12(46): 7503-7507
Published online Dec 14, 2006. doi: 10.3748/wjg.v12.i46.7503
Published online Dec 14, 2006. doi: 10.3748/wjg.v12.i46.7503
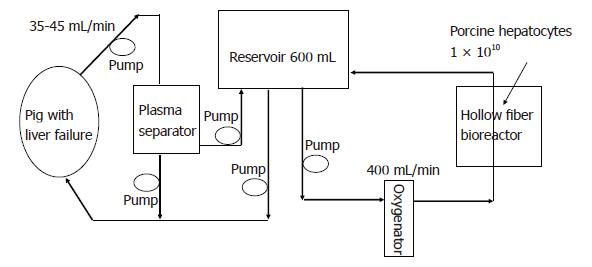
Figure 1 Schematic drawing of our bioartificial liver (BAL) system.
It consists of 1 × 10¹⁰ cultured allogeneic hepatocytes in the outer space of a hollow fiber.
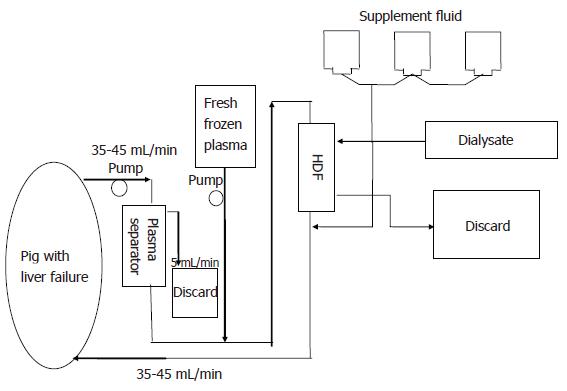
Figure 2 Schematic drawing of continuous plasma exchange (CPE) with allogeneic plasma and continuous hemodiafiltration system (CHDF).
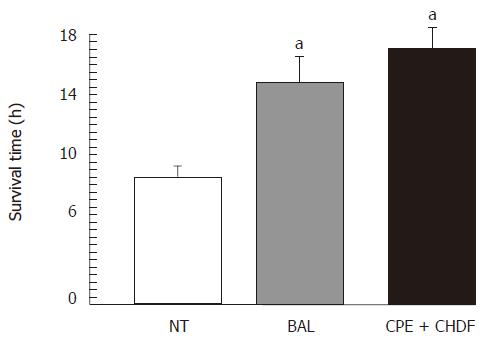
Figure 3 Survival after induction of hepatic failure.
aP < 0.05 vs NT group.
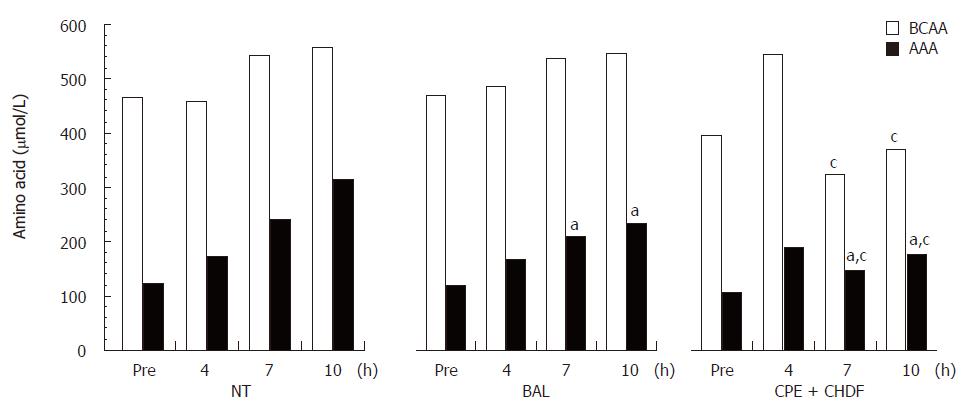
Figure 4 Time transition of the levels of amino acid after induction of acute liver failure in (A) NT group, (B) BAL group and (C) CPE+CHDF group.
aP < 0.05 vs NT group, cP < 0.05 vs NT group and BAL group.
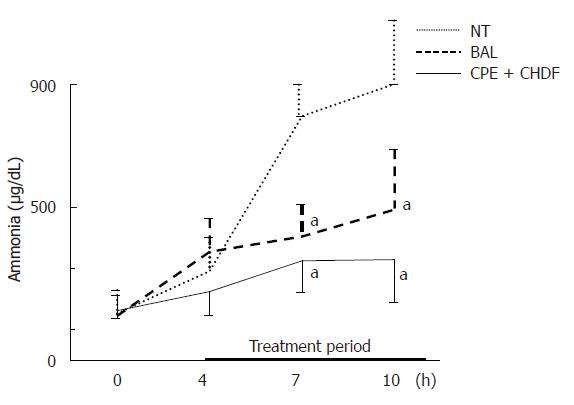
Figure 5 Time transition of the levels of ammonia in the blood after induction of acute liver failure.
aP < 0.05 vs NT group.
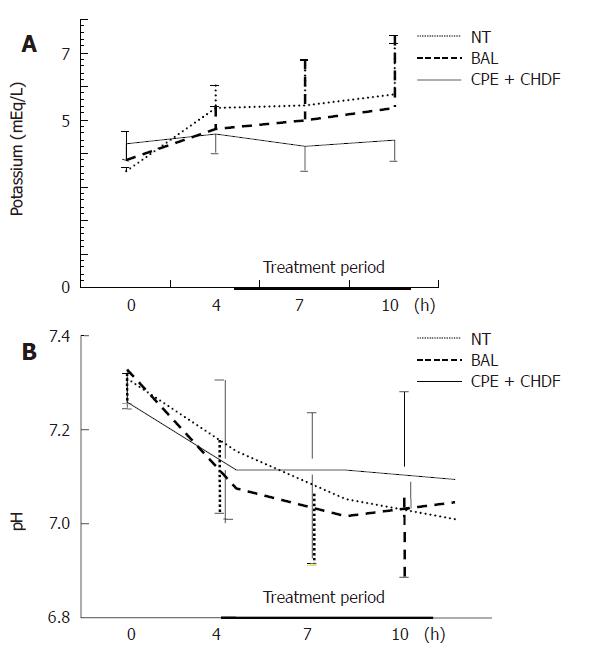
Figure 6 Time transition of the serum levels of (A) potassium and (B) pH after induction of acute liver failure.
- Citation: Kawazoe Y, Eguchi S, Sugiyama N, Kamohara Y, Fujioka H, Kanematsu T. Comparison between bioartificial and artificial liver for the treatment of acute liver failure in pigs. World J Gastroenterol 2006; 12(46): 7503-7507
- URL: https://www.wjgnet.com/1007-9327/full/v12/i46/7503.htm
- DOI: https://dx.doi.org/10.3748/wjg.v12.i46.7503


