Copyright
©2006 Baishideng Publishing Group Co.
World J Gastroenterol. Dec 7, 2006; 12(45): 7365-7370
Published online Dec 7, 2006. doi: 10.3748/wjg.v12.i45.7365
Published online Dec 7, 2006. doi: 10.3748/wjg.v12.i45.7365
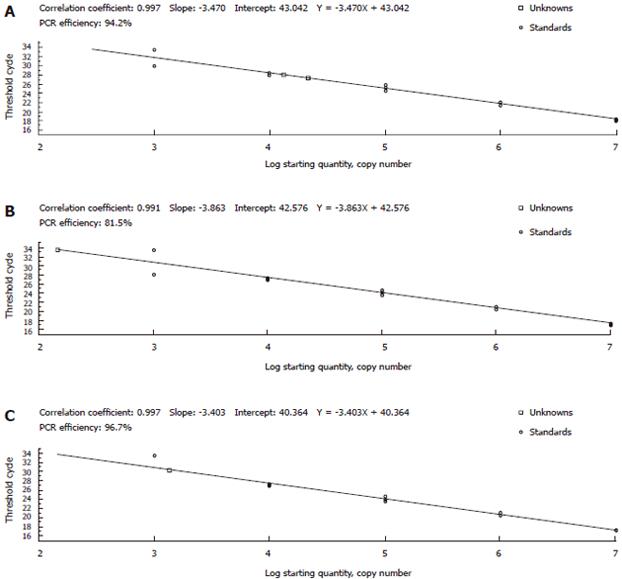
Figure 1 Ct values and copy number of HBV serum samples originated from three standard curves corresponding to the S (A), C (B) and X (C) regions respectively.
Each real-time PCR reaction was performed in triplicate.
Figure 2 A standard curve for evaluation of HBV DNA extraction methods.
- Citation: Lu YQ, Han JX, Qi P, Xu W, Zu YH, Zhu B. Rapid quantification of hepatitis B virus DNA by real-time PCR using efficient TaqMan probe and extraction of virus DNA. World J Gastroenterol 2006; 12(45): 7365-7370
- URL: https://www.wjgnet.com/1007-9327/full/v12/i45/7365.htm
- DOI: https://dx.doi.org/10.3748/wjg.v12.i45.7365


