Copyright
©2006 Baishideng Publishing Group Co.
World J Gastroenterol. Dec 7, 2006; 12(45): 7271-7277
Published online Dec 7, 2006. doi: 10.3748/wjg.v12.i45.7271
Published online Dec 7, 2006. doi: 10.3748/wjg.v12.i45.7271
Figure 1 Mean viral decline over time in each IFN dosing schedule group for HCV genotype 1 (A) and genotype 3 (B) non-cirrhotic patients.
Note that on the first day (vertical line) all groups received 9 MU IFN and had a similar 1st phase decline. A transient rebound was then observed until d 3 in patients who switched to a lower 3 MU IFN dose. Furthermore, patients on a dosing schedule of 3 TIW or 3 Q2D showed viral rebounds on the days they did not receive IFN (d 5-7 for the 3 TIW group and d 5-6 and 7-8 for the 3 Q2D group) in both genotype 1 and 3 patients. However, patients with genotype 3 continued a rapid 2nd phase decline albeit the dosing related transient viral rebounds.
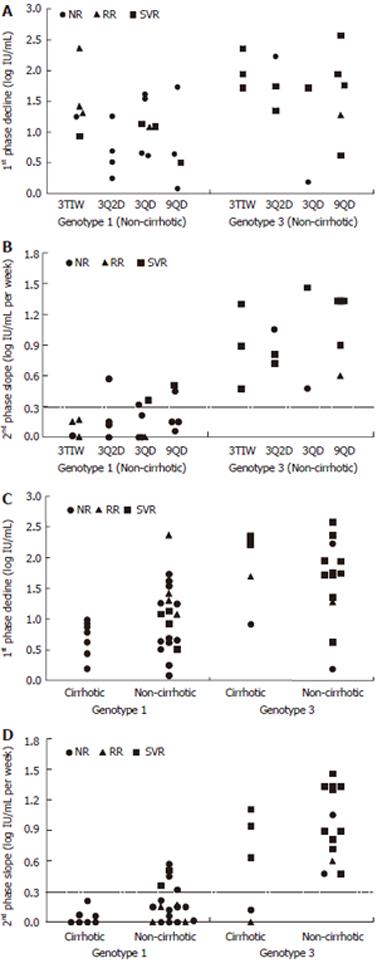
Figure 2 Distributions of the 1st phase decline (A and C) and the 2nd phase slope (B and D) and their correlation with virological end-points given per HCV genotype and dosing schedule for non-cirrhotic patients (A and B) and each HCV genotype and histological status (C and D).
As in previous studies a 2nd phase decline slope slower than 0.3 log IU/mL per week is predictive of non-SVR (horizontal dashed line in B and D).
- Citation: Medeiros-Filho JE, Mello IMVGC, Pinho JRR, Neumann AU, Malta FM, Silva LCD, Carrilho FJ. Differences in viral kinetics between genotypes 1 and 3 of hepatitis C virus and between cirrhotic and non-cirrhotic patients during antiviral therapy. World J Gastroenterol 2006; 12(45): 7271-7277
- URL: https://www.wjgnet.com/1007-9327/full/v12/i45/7271.htm
- DOI: https://dx.doi.org/10.3748/wjg.v12.i45.7271


