Copyright
©2006 Baishideng Publishing Group Co.
World J Gastroenterol. Dec 7, 2006; 12(45): 7263-7270
Published online Dec 7, 2006. doi: 10.3748/wjg.v12.i45.7263
Published online Dec 7, 2006. doi: 10.3748/wjg.v12.i45.7263
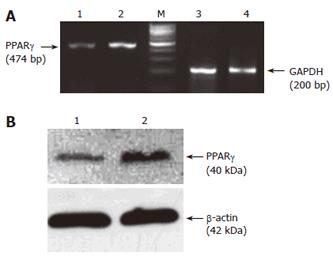
Figure 1 PPARγ expression in HCT-116 and HCT-15 cells detected by RT-PCR (A) and Western blot (B).
Lane 1: HCT-15 cells; lane 2: HCT-116 cells; M: marker; lanes 3 and 4: GAPDH.
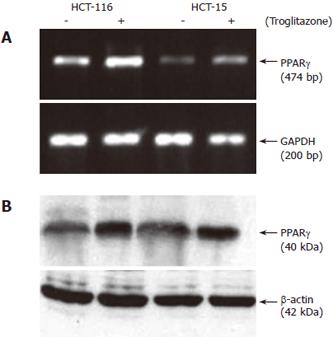
Figure 2 Effect of troglitazone on PPARγ expression in HCT-116 and HCT-15 cells detected by RT-PCR (A) and Western blot (B).
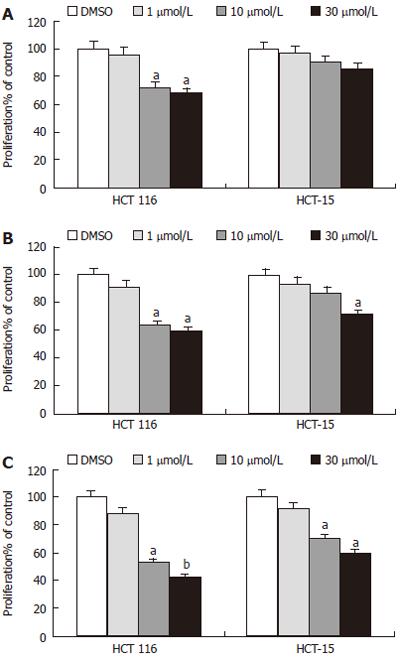
Figure 3 Effect of troglitazone on proliferation of colon cancer cells at 12 h (A), 24 h (B), 48 h (C).
The percentages of cell growth were compared with DMSO (solvent control was set at 100%). aP < 0.05, bP < 0.01 vs corresponding control group respectively.
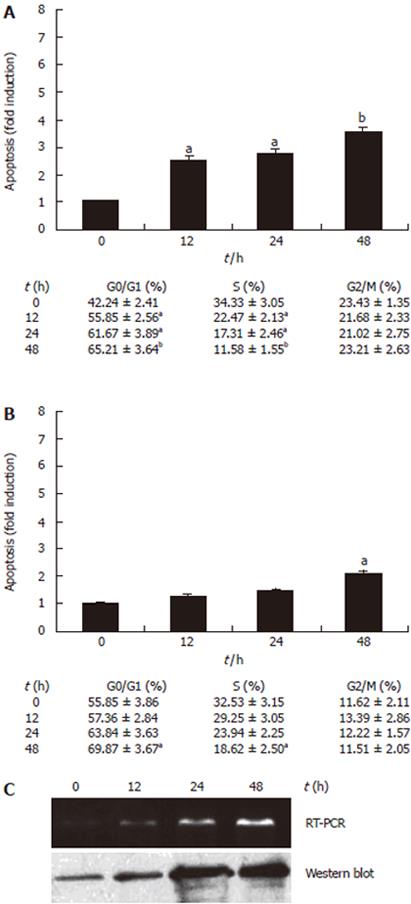
Figure 4 Effect of troglitazone on cell cycle and apoptosis in HCT-116 (A) and HCT-15 (B) cells and p53 expression in HCT-116 cells (C).
aP < 0.05, bP < 0.01 vs corresponding control group respectively.
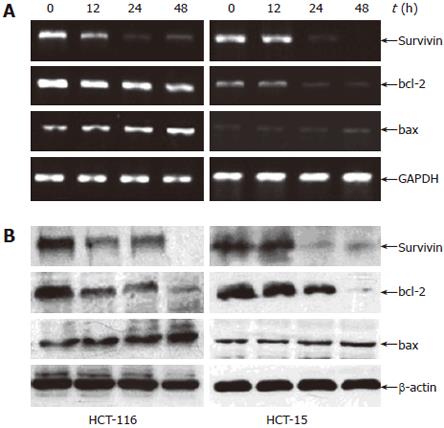
Figure 5 Effect of troglitazone on survivin, bcl-2 and bax expression by RT-PCR (A) and Western blot (B) in HCT-116 and HCT-15 cells.
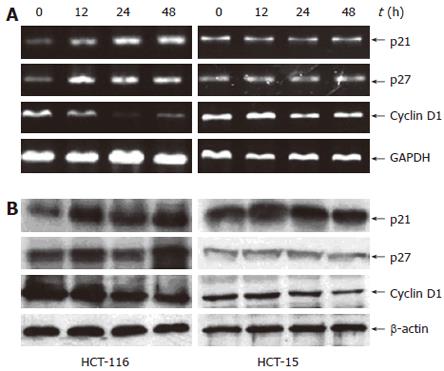
Figure 6 Effect of troglitazone on p21, p27, and cyclin D1 expression by RT-PCR (A) and Western blot (B) in HCT-116 and HCT-15 cells.
- Citation: Ming M, Yu JP, Meng XZ, Zhou YH, Yu HG, Luo HS. Effect of ligand troglitazone on peroxisome proliferator-activated receptor γ expression and cellular growth in human colon cancer cells. World J Gastroenterol 2006; 12(45): 7263-7270
- URL: https://www.wjgnet.com/1007-9327/full/v12/i45/7263.htm
- DOI: https://dx.doi.org/10.3748/wjg.v12.i45.7263


