Copyright
©2006 Baishideng Publishing Group Co.
World J Gastroenterol. Nov 28, 2006; 12(44): 7149-7154
Published online Nov 28, 2006. doi: 10.3748/wjg.v12.i44.7149
Published online Nov 28, 2006. doi: 10.3748/wjg.v12.i44.7149
Math 1 Math 1
Math 2 Math 2
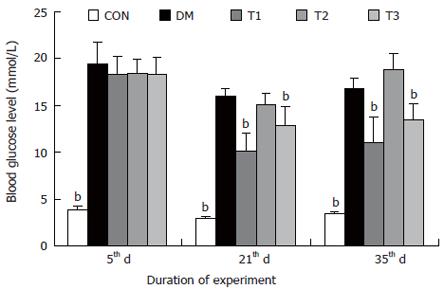
Figure 1 The blood glucose levels in different groups, compared with DM group (bP < 0.
01).
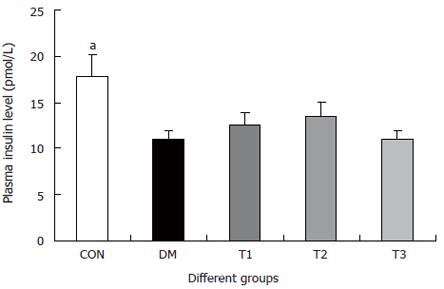
Figure 2 The serum insulin levels in different groups, compared with DM group (aP < 0.
05).
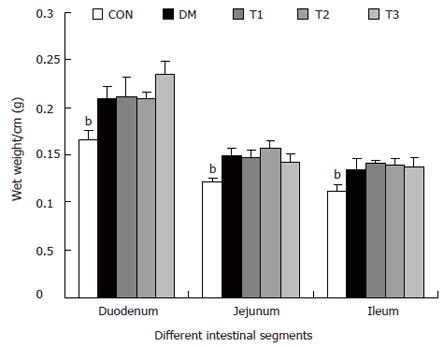
Figure 3 The intestinal wet weight of different segments per centimeter long in different groups, compared with DM group (bP < 0.
01).
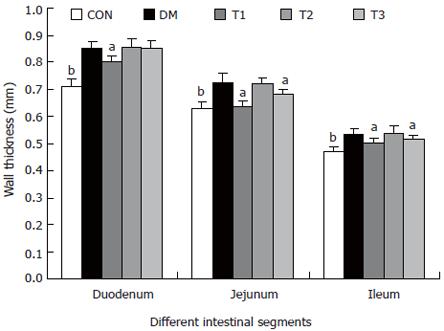
Figure 4 The intestinal wall thickness of different segments in different groups, compared with DM group (aP < 0.
05; bP < 0.01).
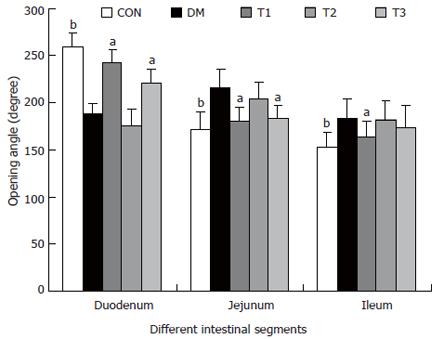
Figure 5 The opening angles of different intestinal segments in different groups, compared with DM group (aP < 0.
05; bP < 0.01).
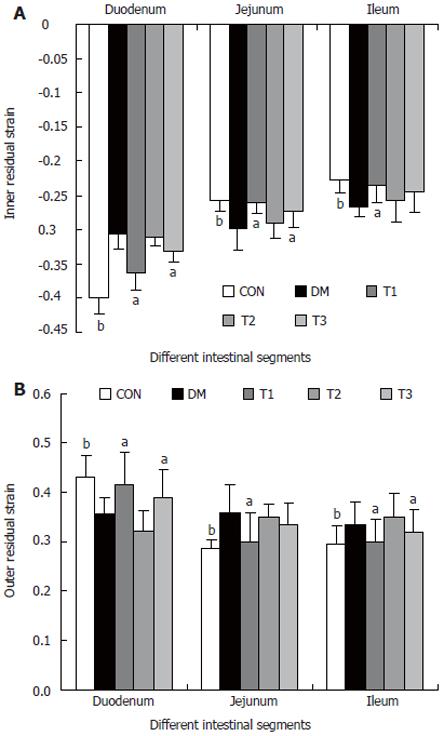
Figure 6 The inner (A) and outer (B) residual strain distribution of different intestinal segments in different groups, compared with DM group (aP < 0.
05; bP < 0.01).
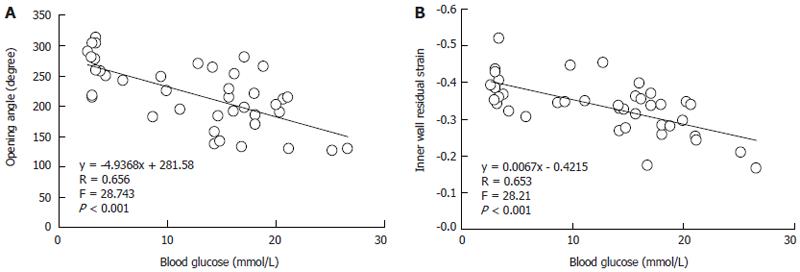
Figure 7 The examples of association between the glucose with opening angle (A) and inner residual strain (B) in duodenal segment.
- Citation: Sha H, Zhao JB, Zhang ZY, Zhou SP, Tong XL, Zhuang FY, Gregersen H. Effect of Kaiyu Qingwei Jianji on the morphometry and residual strain distribution of small intestine in experimental diabetic rats. World J Gastroenterol 2006; 12(44): 7149-7154
- URL: https://www.wjgnet.com/1007-9327/full/v12/i44/7149.htm
- DOI: https://dx.doi.org/10.3748/wjg.v12.i44.7149


