Copyright
©2006 Baishideng Publishing Group Co.
World J Gastroenterol. Nov 28, 2006; 12(44): 7143-7148
Published online Nov 28, 2006. doi: 10.3748/wjg.v12.i44.7143
Published online Nov 28, 2006. doi: 10.3748/wjg.v12.i44.7143
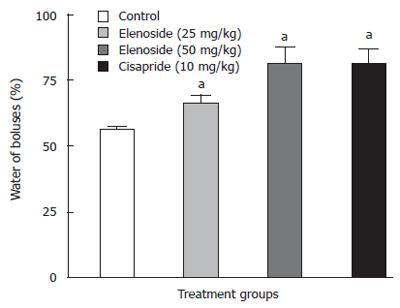
Figure 1 Percentage increase in water of boluses in vehicle control, elenoside, and cisapride.
Values are mean ± SE for 10 rats/group. aP < 0.05 vs control.
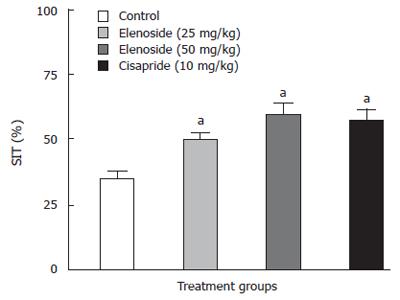
Figure 2 Small intestinal transit (SIT) in vehicle control and elenoside-treated and cisapride-treated animals.
Values are mean ± SE for 10 rats/group. aP < 0.05 vs control.
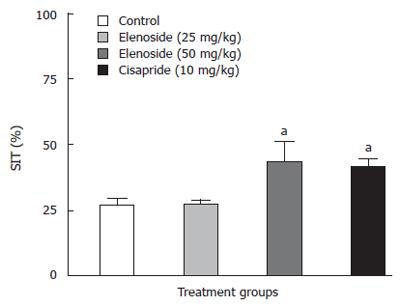
Figure 3 Codeine phosphate induced delay in small intestinal transit (SIT) in vehicle control, elenoside, and cisapride groups.
Values are mean ± SE for 10 rats/group. aP < 0.05 vs control.
Figure 4 A: Time-course of the effects of elenoside and cisapride on contraction force in rat duodenum vs baseline.
Values are mean ± SE for 10 duodenum samples during 6 min; aP < 0.05. B: Time-course of the effects of elenoside and cisapride on contraction force in rat jejunum vs baseline. Values are mean ± SE for 10 jejunum samples during 6 min; aP < 0.05. C: Time-course of the effects of elenoside and cisapride on contraction force in rat ileum vs baseline. Values are mean ± SE for 10 ileum samples during 6 min; aP < 0.05.
Figure 5 A: Time-course of the effects of elenoside and cisapride on intestinal frequency in the rat duodenum vs baseline.
Values are mean ± SE for 10 duodenum samples during 6 min; aP < 0.05. B: Time-course of the effects of elenoside and cisapride on intestinal frequency in the rat jejunum vs baseline. Values are mean ± SE for 10 jejunum samples during 6 min; aP < 0.05. C: Time-course of the effects of elenoside and cisapride on intestinal frequency in the rat ileum vs baseline. Values are mean ± SE for 10 ileum samples during 6 min; aP < 0.05.
- Citation: Navarro E, Alonso S, Navarro R, Trujillo J, Jorge E. Elenoside increases intestinal motility. World J Gastroenterol 2006; 12(44): 7143-7148
- URL: https://www.wjgnet.com/1007-9327/full/v12/i44/7143.htm
- DOI: https://dx.doi.org/10.3748/wjg.v12.i44.7143


