Copyright
©2006 Baishideng Publishing Group Co.
World J Gastroenterol. Nov 21, 2006; 12(43): 6973-6981
Published online Nov 21, 2006. doi: 10.3748/wjg.v12.i43.6973
Published online Nov 21, 2006. doi: 10.3748/wjg.v12.i43.6973
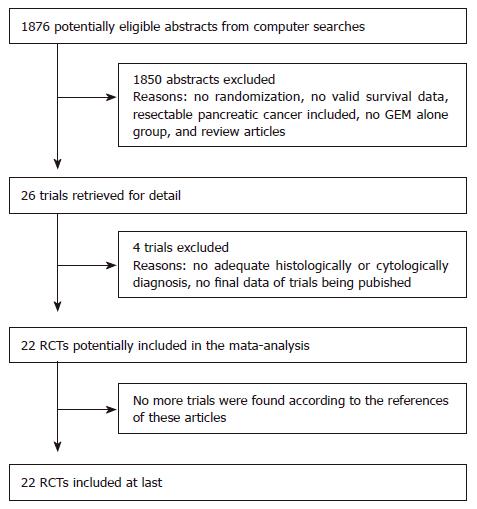
Figure 1 The flow chart.
GEM: gemcitabine; RCTs: randomized controlled trials.
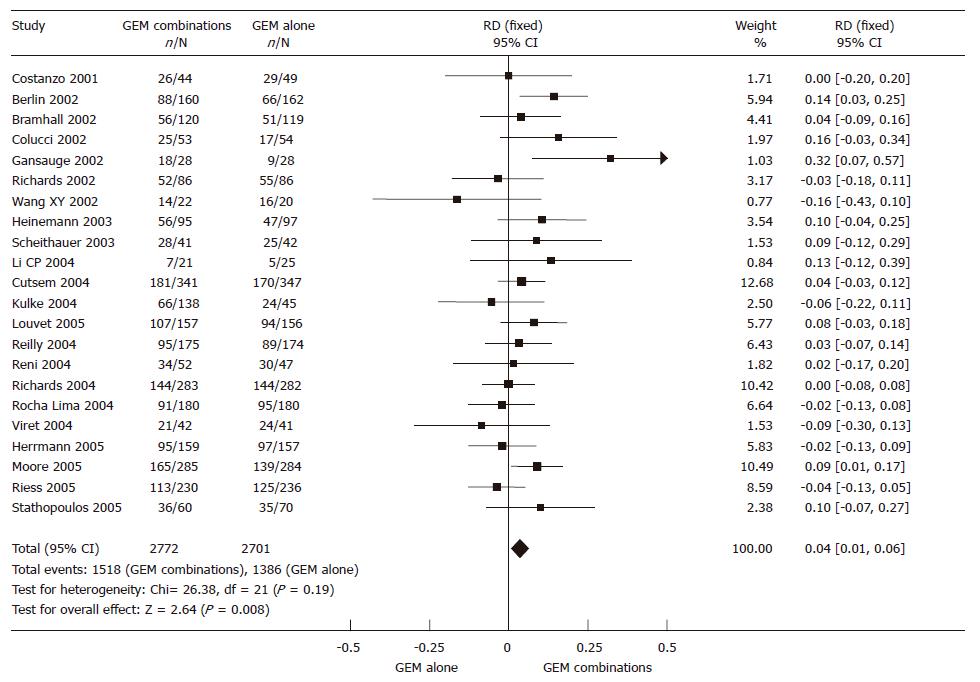
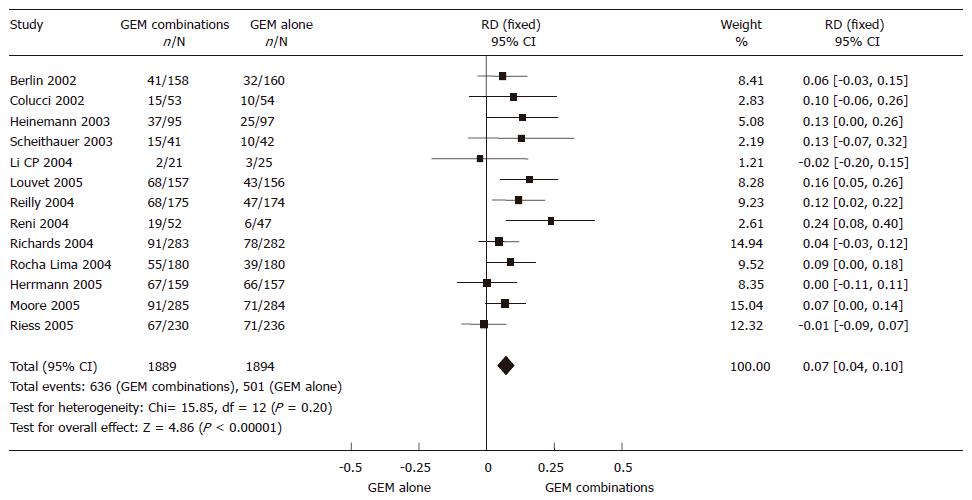
Figure 2 Fixed effect model on RD of 6-mo survival rate.
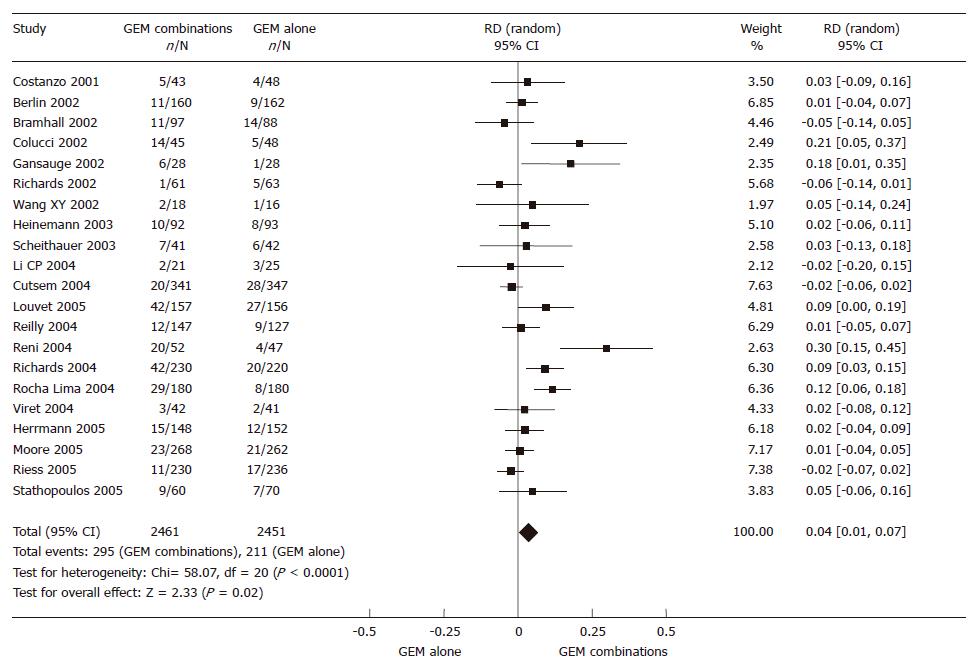
Figure 3 Random effect model on RD of ORR.
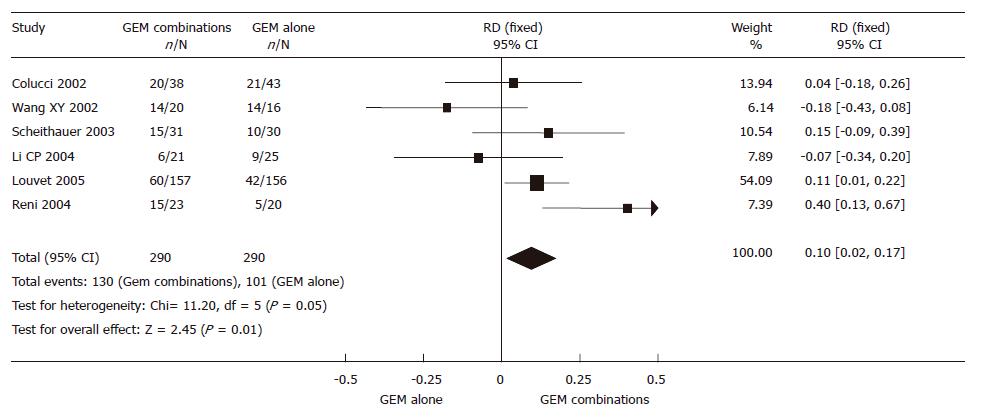
Figure 4 Fixed effect model on RD of CBR.
Figure 5 Fixed effect model on RD of 6-mo TTP/PFS rate.
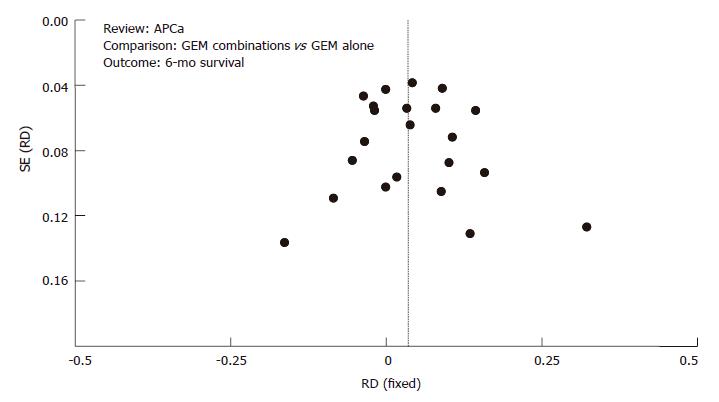
Figure 6 Funnel plots for 6-mo survival rate.
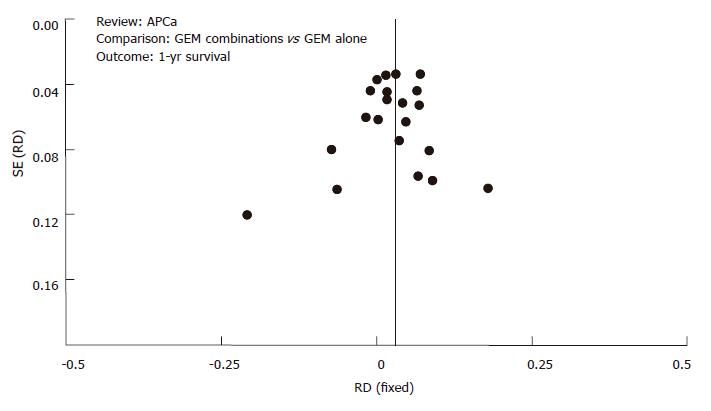
Figure 7 Funnel plots for 1-yr survival rate.
- Citation: Xie DR, Liang HL, Wang Y, Guo SS, Yang Q. Meta-analysis on inoperable pancreatic cancer: A comparison between gemcitabine-based combination therapy and gemcitabine alone. World J Gastroenterol 2006; 12(43): 6973-6981
- URL: https://www.wjgnet.com/1007-9327/full/v12/i43/6973.htm
- DOI: https://dx.doi.org/10.3748/wjg.v12.i43.6973


