Copyright
©2006 Baishideng Publishing Group Co.
World J Gastroenterol. Nov 14, 2006; 12(42): 6842-6849
Published online Nov 14, 2006. doi: 10.3748/wjg.v12.i42.6842
Published online Nov 14, 2006. doi: 10.3748/wjg.v12.i42.6842
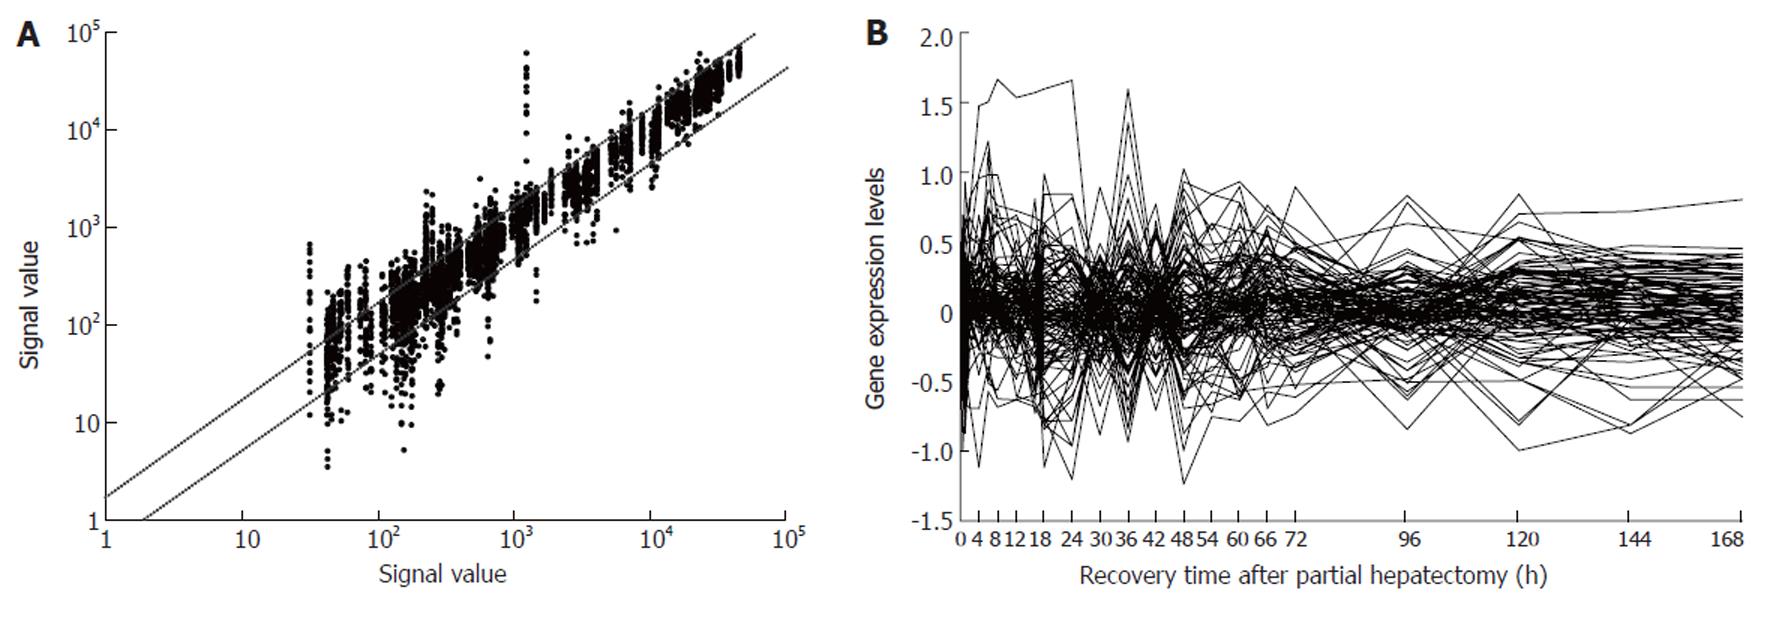
Figure 1 Expression frequency, abundance and changes of 107 blood coagulation response-associated genes during rat liver regeneration.
Detection data of Rat Genome 230 2.0 array were analyzed and graphed with Microsoft Excel. A: Gene expression frequency. The dots above bias represent the genes up-regulated more than two fold, and total times of up-regulation were 342; those below bias down-regulated more than two fold, and times of down-regulation were 253; and the ones between biases no-sense alteration; B: Gene expression abundance and changes. Seventy-six genes were 2-46 fold up-regulated, and 62 genes 2-10 fold down- regulated.
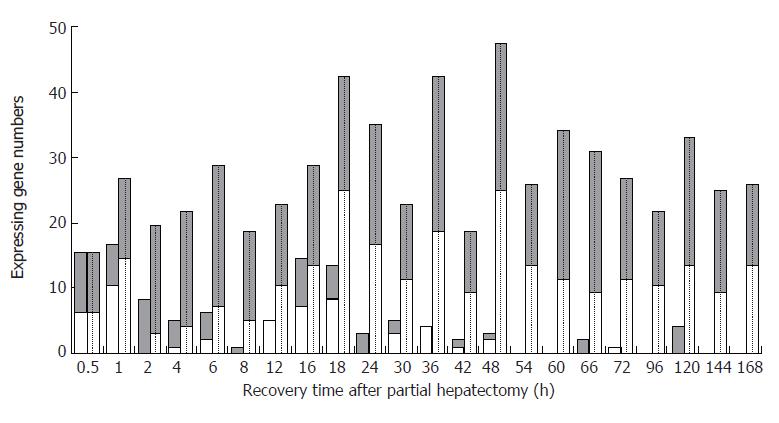
Figure 2 The initial and total expression profiles of 107 blood coagulation response-associated genes at each time point of liver regeneration.
Grey bars: Up-regulated gene; White bars: Down-regulated. Blank bars represent initial expressing genes, in which up-regulated genes were predominant in the forepart, and the down-regulated genes in the prophase and metaphase, whereas there was little initial expression in the anaphase. Dotted bars represent the total expressing genes, in which some genes were up-regulated, and the others down regulated during the whole LR.
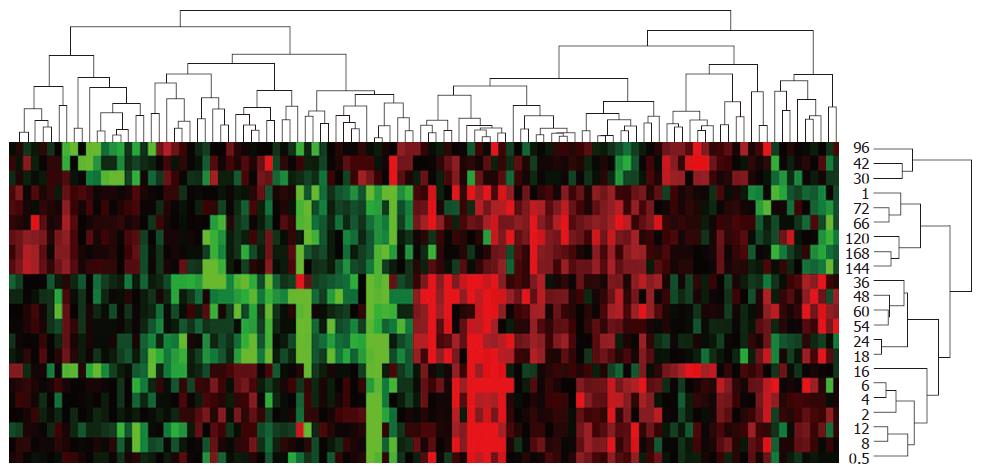
Figure 3 Expression similarity and time relevance clusters of 107 blood coagulation response-associated genes during liver regeneration.
Detection data of Rat Genome 230 2.0 array were analyzed by H-clustering. Red represents up-regulated genes chiefly associated with promoting blood coagulation; Green represents down-regulated ones mainly associated with inhibiting blood coagulation; Black: No-sense in expression change. The upper and right trees respectively show expression similarity and time series clusters, by which the above genes were classified into 5 and 15 groups separately.
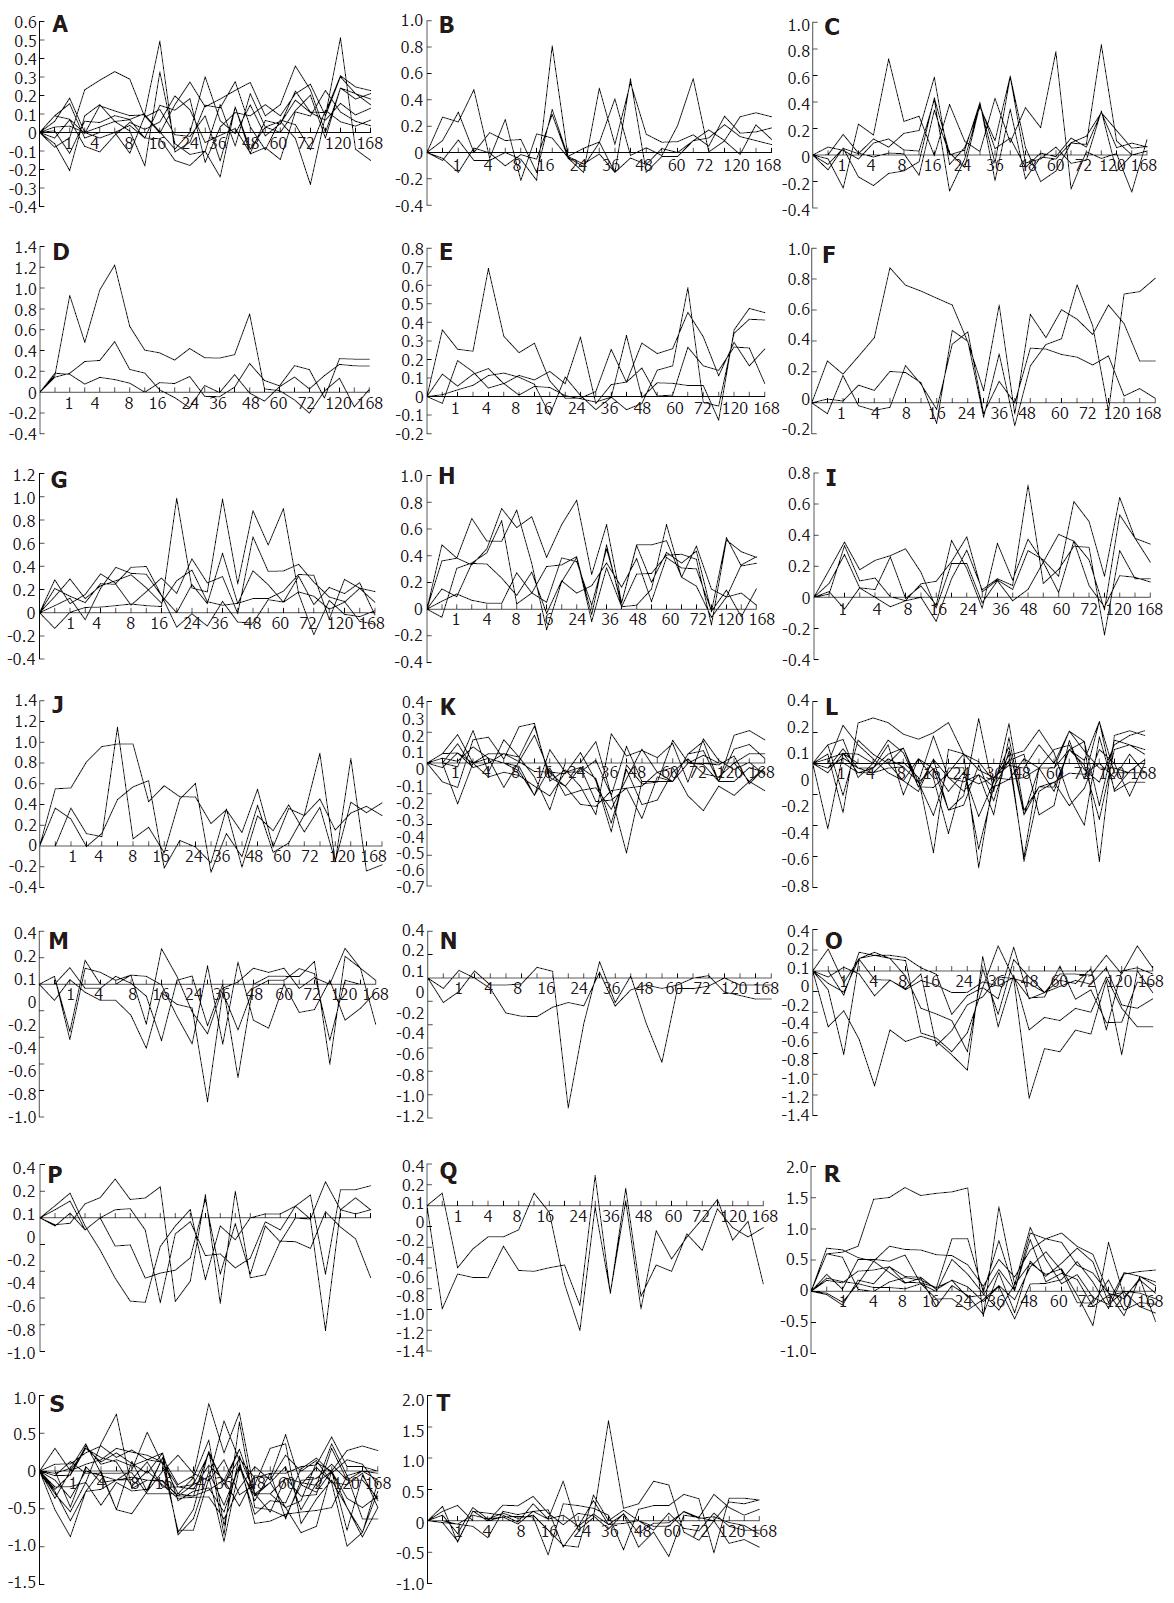
Figure 4 Twenty-nine gene expression patterns of 107 blood coagulation response-associated genes during liver regeneration.
Expression patterns were obtained by the analysis of detection data of Rat Genome 230 2.0 array with Microsoft Excel. A-J: 44 up-regulated genes; K-Q: 36 down-regulated genes; R-T: 27 up/down-regulated genes. X-axis represents recovery time after partial hepatectomy (h); Y-axis shows logarithm ratio of the signal values of genes at each time point to control.
- Citation: Zhao LF, Zhang WM, Xu CS. Expression patterns and action analysis of genes associated with blood coagulation responses during rat liver regeneration. World J Gastroenterol 2006; 12(42): 6842-6849
- URL: https://www.wjgnet.com/1007-9327/full/v12/i42/6842.htm
- DOI: https://dx.doi.org/10.3748/wjg.v12.i42.6842


