Copyright
©2006 Baishideng Publishing Group Co.
World J Gastroenterol. Nov 14, 2006; 12(42): 6835-6841
Published online Nov 14, 2006. doi: 10.3748/wjg.v12.i42.6835
Published online Nov 14, 2006. doi: 10.3748/wjg.v12.i42.6835
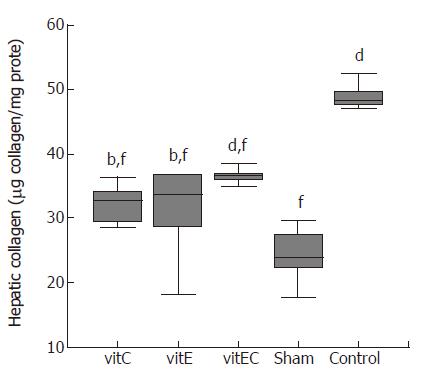
Figure 1 Effect of treatment on liver collagen content by biochemical method.
bP < 0.01, dP < 0.001 vs sham; fP < 0.001 vs control.
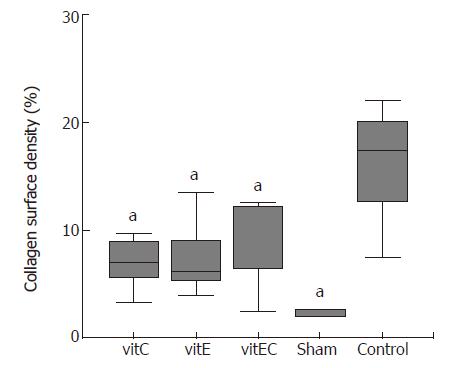
Figure 2 Effects of vitamin E, C and combination treatment on hepatic fibrosis as determined by computerized image analysis.
aP < 0.05 vs control.
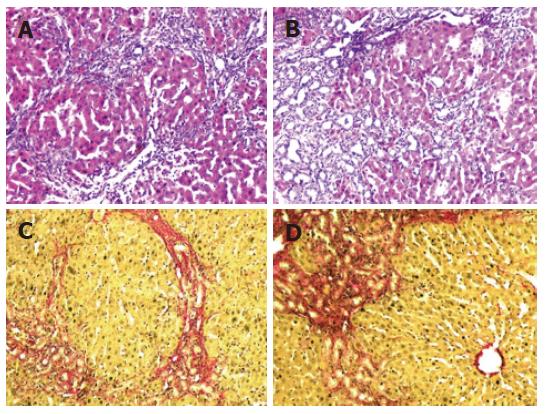
Figure 3 A: Necroinflammation disperses the lobular parenchyma from the portal areas (HE x 100); B: Prominent bile duct proliferation; C, D: Severe portal fibrosis with porto-portal bridging by sirius red collagen stain (x 100).
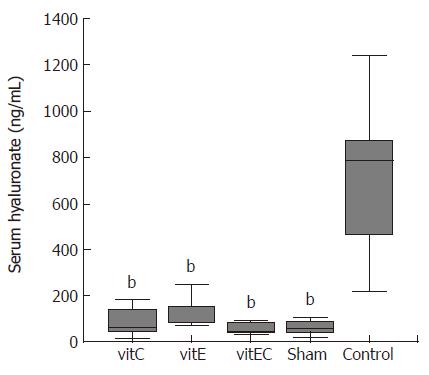
Figure 4 Effects of vitamin E, C and combination treatment on serum hyaluronate levels.
bP < 0.001 vs control.
- Citation: Soylu AR, Aydogdu N, Basaran UN, Altaner S, Tarcin O, Gedik N, Umit H, Tezel A, Dokmeci G, Baloglu H, Ture M, Kutlu K, Kaymak K. Antioxidants vitamin E and C attenuate hepatic fibrosis in biliary-obstructed rats. World J Gastroenterol 2006; 12(42): 6835-6841
- URL: https://www.wjgnet.com/1007-9327/full/v12/i42/6835.htm
- DOI: https://dx.doi.org/10.3748/wjg.v12.i42.6835


