Copyright
©2006 Baishideng Publishing Group Co.
World J Gastroenterol. Nov 7, 2006; 12(41): 6614-6619
Published online Nov 7, 2006. doi: 10.3748/wjg.v12.i41.6614
Published online Nov 7, 2006. doi: 10.3748/wjg.v12.i41.6614
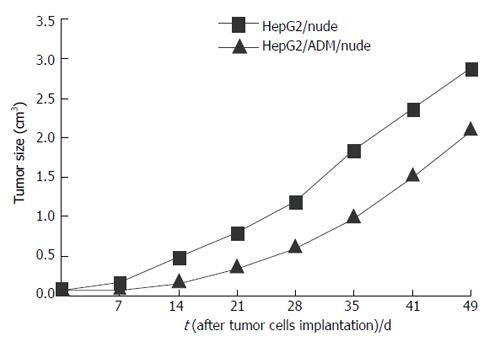
Figure 1 Growth curves of tumors after implantation of HepG2 or HepG2/ADM cells in nude mice.
Athymic mice were injected s.c. with 1 × 10⁷ (0.2 mL/mouse) HepG2 or HepG2/ADM cells on d 0. Symbols and bars denote the means and SD for 10 nude mice in the HepG2 group and 10 nude mice in the HepG2/ADM group.
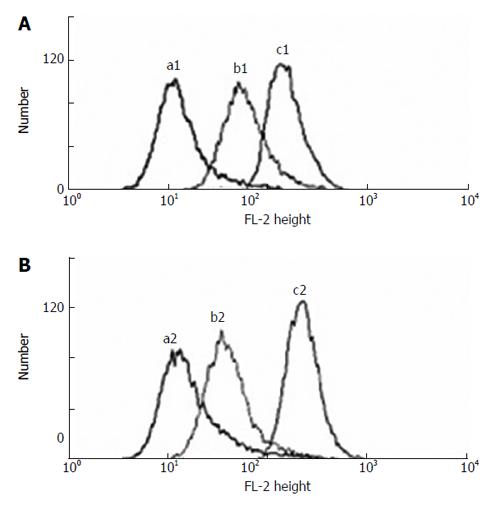
Figure 2 Retention and efflux of rhodamine 123 in HepG2/ADM/nude cells measured by flow cytometry.
A: Intracellular Rh123 retention. a1: HepG2/ADM/nude cells incubated in RPMI 1640 medium; b1: HepG2/ADM/nude cells incubated with Rh123; c1: HepG2/nude cells incubated with Rh123; B: Rh123 Efflux. a2: HepG2/ADM/nude cells incubated in RPMI 1640 medium; b2: HepG2/ADM/nude cells incubated with Rh123; C2: HepG2/nude cells incubated with Rh123.
Figure 3 mRNA expression of mdr1, MRP and LRP in HepG2/nude and HepG2/ADM/nude cells.
Lane M: 100-bp DNA marker; lane 1: HepG2 cell line; lane 2: HepG2/ADM cell subline; lane 3: HepG2 cells in nude mice; lane 4: HepG2/ADM in nude mice.
- Citation: Zhai BJ, Shao ZY, Zhao CL, Hu K, Wu F. Development and characterization of multidrug resistant human hepatocarcinoma cell line in nude mice. World J Gastroenterol 2006; 12(41): 6614-6619
- URL: https://www.wjgnet.com/1007-9327/full/v12/i41/6614.htm
- DOI: https://dx.doi.org/10.3748/wjg.v12.i41.6614


