Copyright
©2006 Baishideng Publishing Group Co.
World J Gastroenterol. Oct 28, 2006; 12(40): 6567-6571
Published online Oct 28, 2006. doi: 10.3748/wjg.v12.i40.6567
Published online Oct 28, 2006. doi: 10.3748/wjg.v12.i40.6567
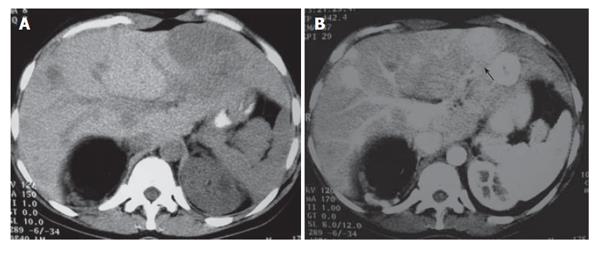
Figure 1 A: Unenhanced transverse CT scan demonstrates multiple hypoattenuating masses located on both liver lobes.
Fatty tissue (known angiomyolipoma) replaces the most of the upper pole of the right kidney; B: Post-contrast CT scan depicts multiple round liver lesions, with a smooth margin, which demonstrate intense homogeneous enhancement. The lesion located in segment three, has a small central area of hypodensity, consistent with a central scar.
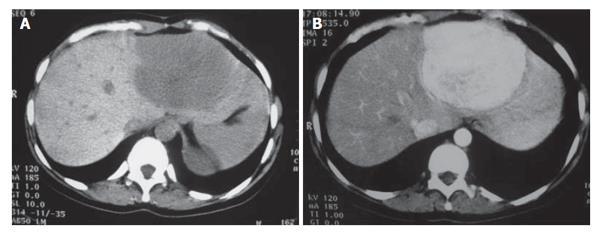
Figure 2 A: Pre-contrast CT scan 3 mo later, revealing the significant increase in the size of the lesion located in the left liver lobe; B: Post-contrast image at the same level showing the increased contrast uptake of the lesion.
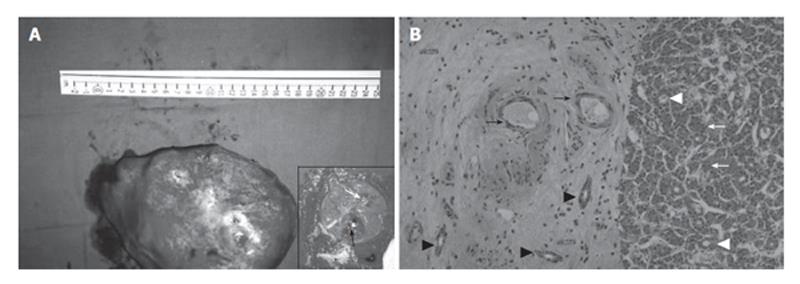
Figure 3 A: Photograph of the surgical specimen.
The inset shows the cut surface: White arrow points at the scar of FNH and black arrow shows the hepatocellular carcinoma; B: Photomicrograph from the lesion. Left: Connective tissue from the core of FNH containing thin wall vessels (black arrows) and cholangioles (black arrowheads). Right: hepatocellular carcinoma. The tumor shows a trabecular growth pattern (white arrows) and focal pseudoglandular transformation (white arrowheads) (HE x 100).
Figure 4 Microphotograph showing details of the tumor.
A, B: The tumor displays a trabecular growth pattern (A-arrow, B-arrow) with focal pseudoglandular transformation (A-arrowhead) (HE, A × 250, B × 400); C: Tumor cells show positive immunohistochemical stain for hepatocyte antigen (arrows-streptavidin biotin peroxidase × 250); D: Tumor cells show positive immunohistochemical stain for cytokeratin 18 (arrows-streptavidin biotin peroxidase × 400); E: Immunohistochemical stain for polyclonal carcinoembryonic antigen displays a canalicular pattern (arrows-streptavidin biotin peroxidase × 100).
- Citation: Petsas T, Tsamandas A, Tsota I, Karavias D, Karatza C, Vassiliou V, Kardamakis D. A case of hepatocellular carcinoma arising within large focal nodular hyperplasia with review of the literature. World J Gastroenterol 2006; 12(40): 6567-6571
- URL: https://www.wjgnet.com/1007-9327/full/v12/i40/6567.htm
- DOI: https://dx.doi.org/10.3748/wjg.v12.i40.6567


